

MyApache Access Logs
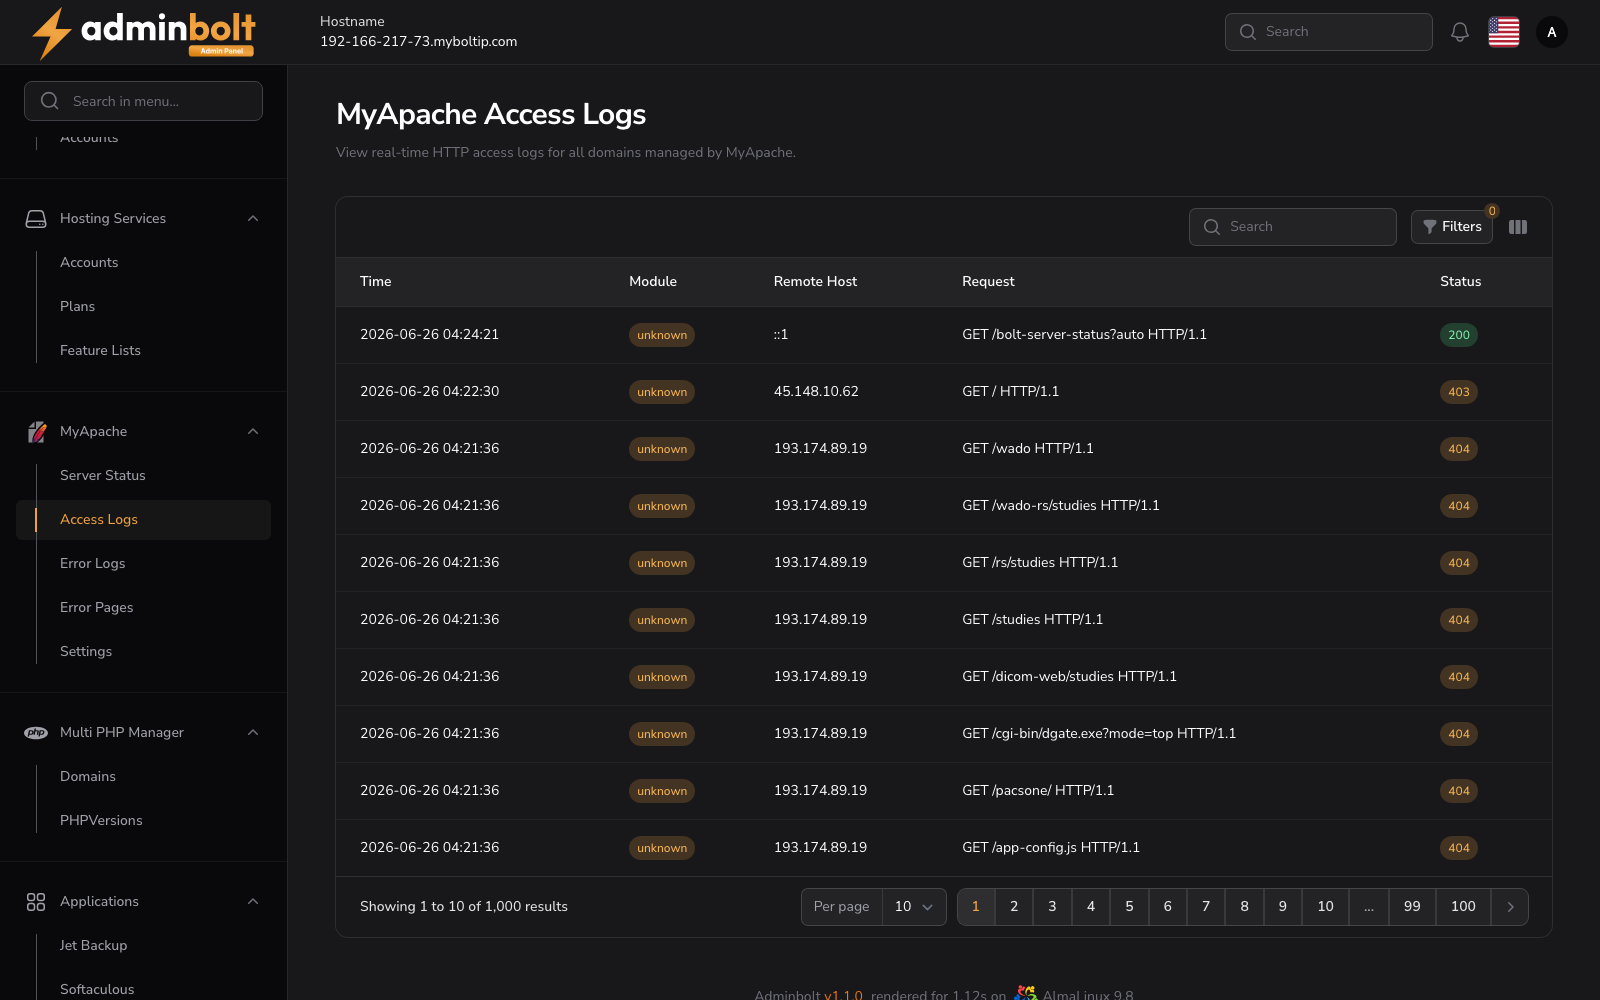
The MyApache Access Logs page provides a real-time overview of all HTTP requests made to domains managed by the MyApache module.
Overview
URL: /admin/my-apache-access-logs
This section allows administrators to monitor, search, and filter incoming HTTP requests in real time. It helps in debugging issues, tracking malicious requests, and understanding traffic patterns.
Interface Elements
Search and Filters
Located at the top right above the log table:
- Search Bar - Search any keyword from the logs (e.g., IP, URL, method).
- Filters Panel (accessible via the Filters button):
- Module - Filter logs by module.
- Level - Filter by severity level (All, EMERGENCY, ALERT, CRITICAL, ERROR, WARNING, NOTICE, INFO, DEBUG).
- Status - Filter by HTTP status code.
- Remote Host - Filter by the client IP address.
- Remote User - Filter by the authenticated remote user.
- Request - Filter by the HTTP request line.
- Referer - Filter by the referring URL.
- User Agent - Filter by the client user agent string.
- Virtual Host - Filter by the virtual host that served the request.
- Date Range - Set
FromandUntildates to filter by time.
- Reset - Clears all active filters.
- Toggle columns - Show or hide table columns, including Remote User, Bytes, Referer, User Agent, and Virtual Host.
Log Table
| Column | Description |
|---|---|
| Time | Timestamp of the HTTP request. |
| Module | The module or source that generated the log entry. |
| Remote Host | The IP address of the client that made the request. |
| Request | The HTTP request line including method, URL path, and protocol. |
| Status | The HTTP response status code, color-coded: green for 2xx (success), orange for 4xx (client errors), red for 5xx (server errors). |
Pagination
At the bottom of the table:
- Choose results per page (e.g., 10, 25, 50, All).
- Navigate through multiple pages of logs.
View Details Modal
Each log entry in the table has a View button with an eye icon
Clicking this icon opens a modal window with the full log details:
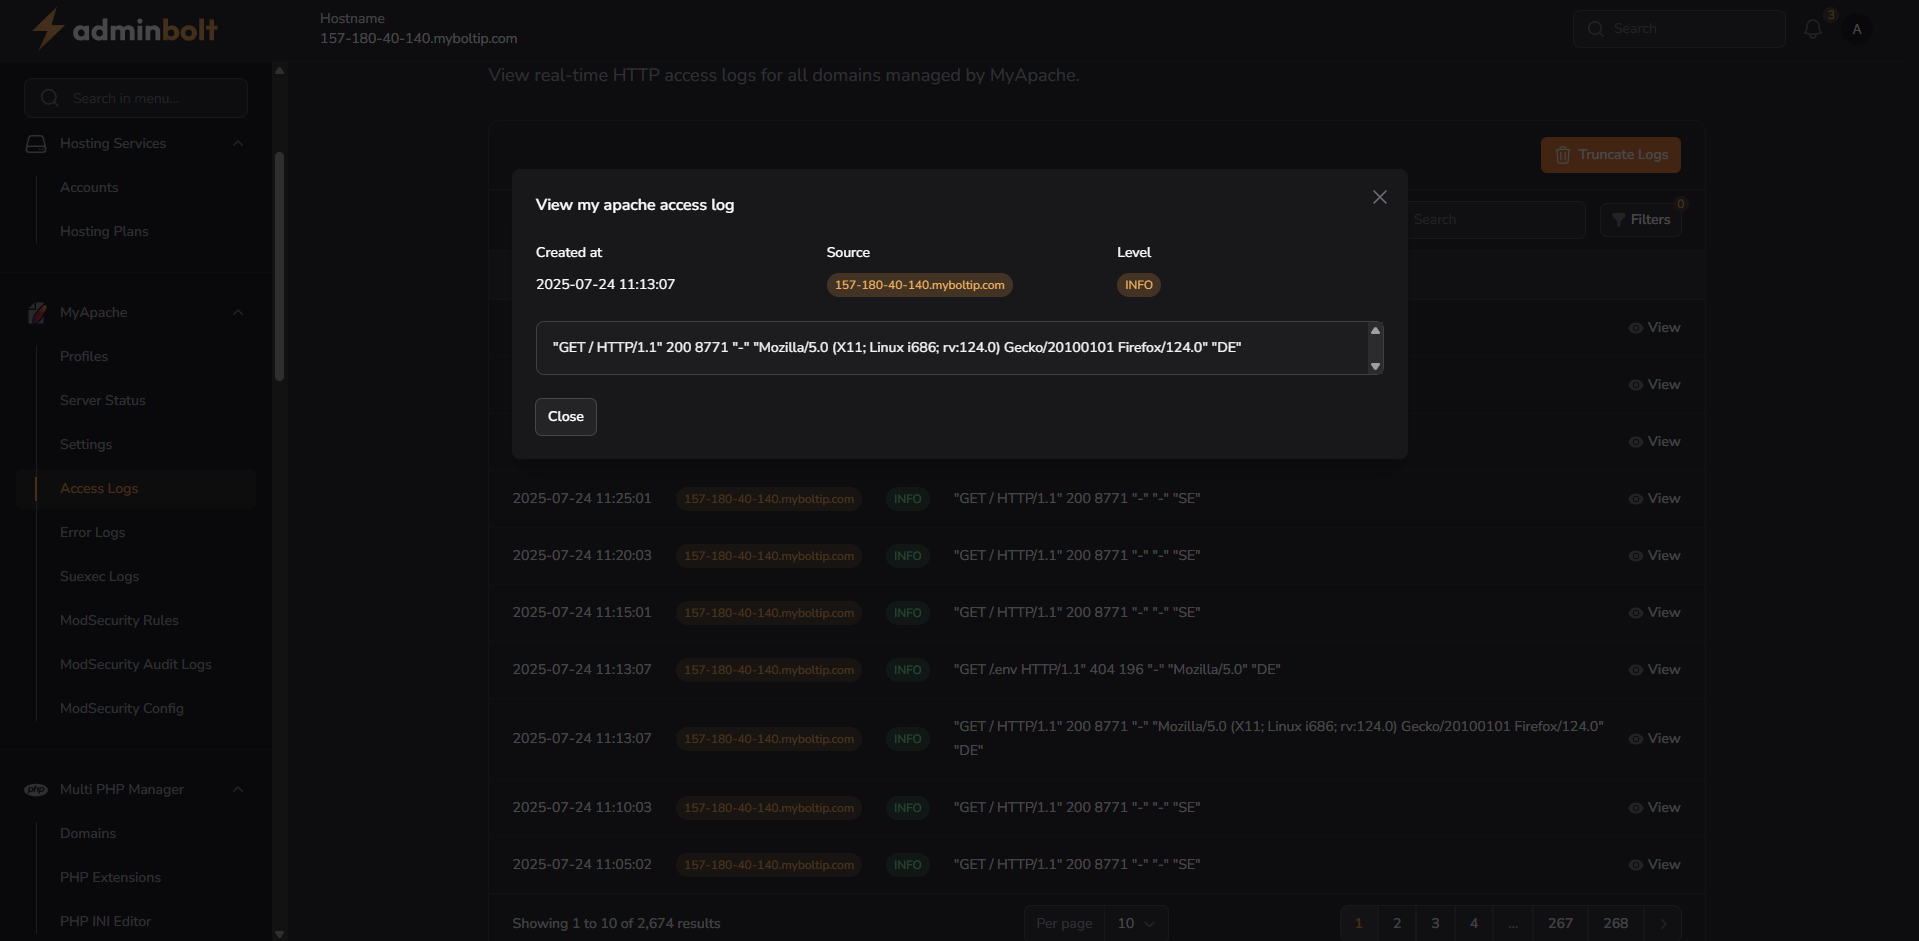
Inside the modal, you can see:
- Created at - Timestamp when the log was recorded
- Module - The module that generated the log entry
- Remote Host - IP address of the client
- Request - Complete HTTP request string
- Status - HTTP response status code