

Service Metrics
The Service Metrics page displays CPU, memory, and process metrics for all system services managed by the server.
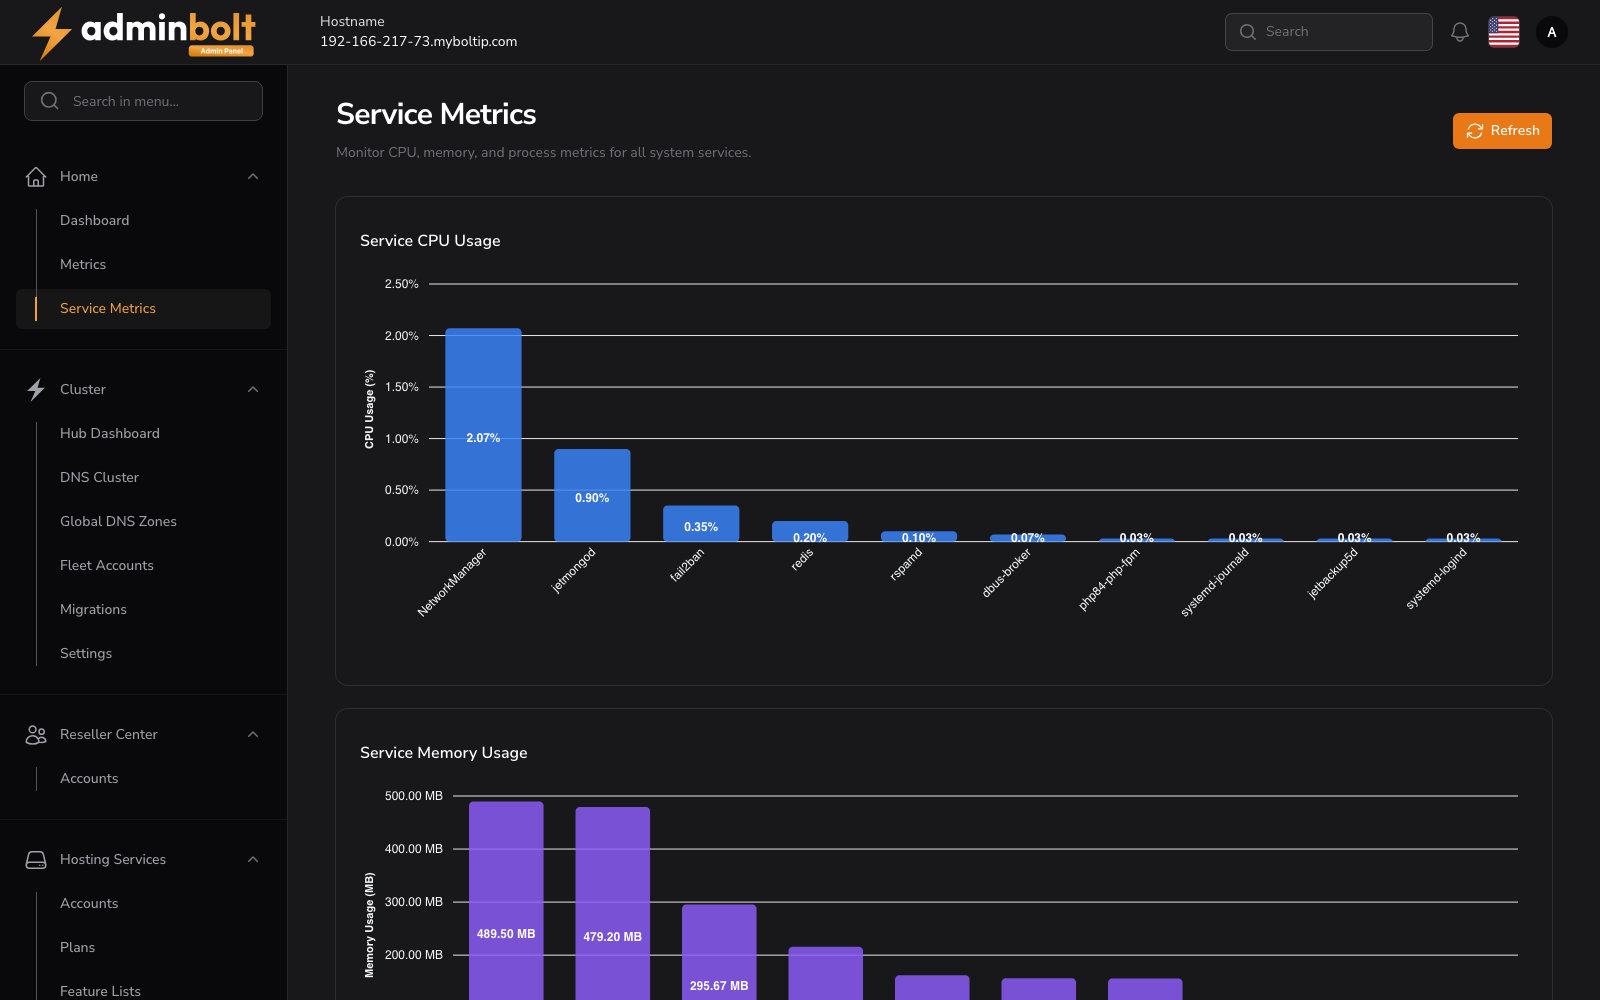
Overview
URL: /admin/service-metrics
The page header reads: "Monitor CPU, memory, and process metrics for all system services."
A Refresh button is available to reload the metrics data.
Summary Cards
Four summary cards are displayed at the top of the page:
- Total Services - The total number of monitored services.
- Average CPU % - The average CPU usage across all services.
- Total Memory - Total memory consumed by all services (in MB).
- Total Processes - Total number of running processes across all services.
Service Table
A searchable, sortable, and paginated table lists all monitored services.
Columns
- Service Name - The name of the service (e.g.,
dovecot,bolt-nginx,pdns,sshd). - CPU % - CPU usage percentage for the service.
- Memory - Memory consumed by the service (in MB).
- Memory % - Memory usage as a percentage of total system memory.
- Processes - Number of processes running for the service.
- Timestamp - When the metrics were last collected, with relative time display.
All columns are sortable by clicking the column header.
Search
The search bar filters results by service name.
Pagination
Results per page can be set to: 5, 10, 25, 50, or All.