

Database Health
The Health page in the Database section provides an overview of database server health status and performance indicators.
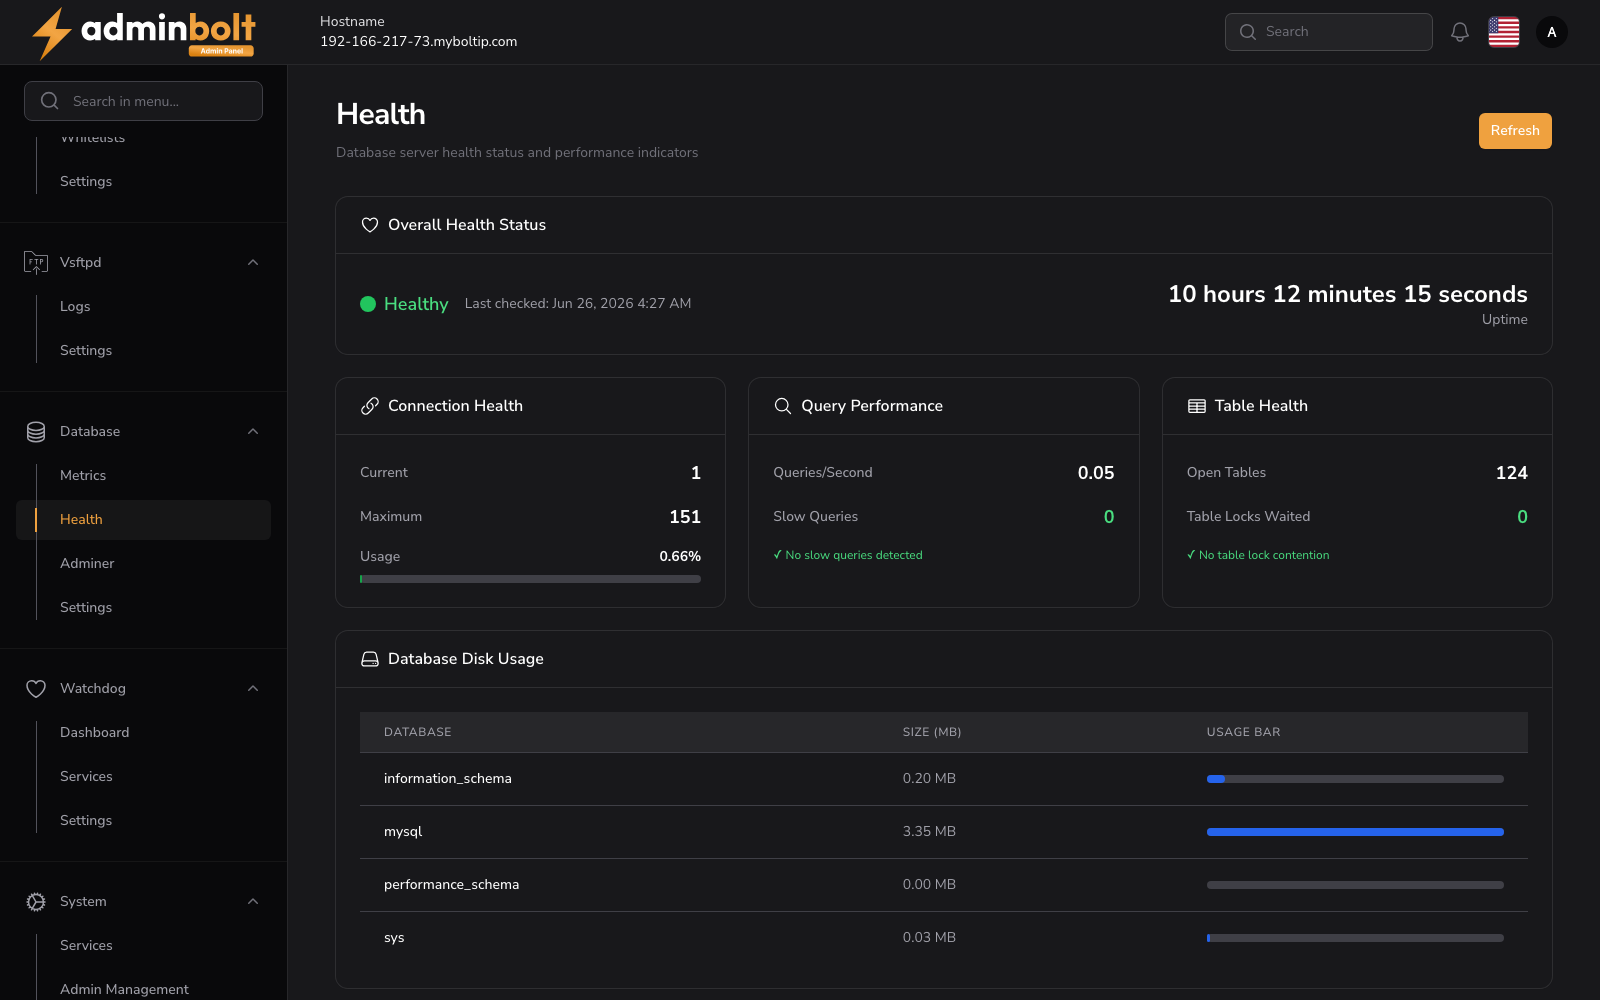
Overview
URL: /admin/database-health
The page header reads: "Database server health status and performance indicators."
A Refresh button is available to reload the health data.
Overall Health Status
Displays the current health status with a color indicator (green for healthy), the last check timestamp, and the server uptime.
Health Cards
Three metric cards provide key health indicators:
Connection Health
- Current - Number of current connections.
- Maximum - Maximum allowed connections.
- Usage - Connection usage percentage with a progress bar.
Query Performance
- Queries/Second - Current query rate.
- Slow Queries - Number of slow queries detected.
- A status message indicating whether slow queries have been detected (e.g., "No slow queries detected").
Table Health
- Open Tables - Number of currently open tables.
- Table Locks Waited - Number of table lock waits.
- A status message indicating table lock contention (e.g., "No table lock contention").
Database Disk Usage
A table shows disk usage per database:
- Database - The database name.
- Size (MB) - Size of the database in megabytes.
- Usage Bar - Visual bar showing relative disk usage.