

Watchdog Services
The Watchdog Services page lists all services registered with the Watchdog monitor and provides controls to register new services or enable bulk monitoring.
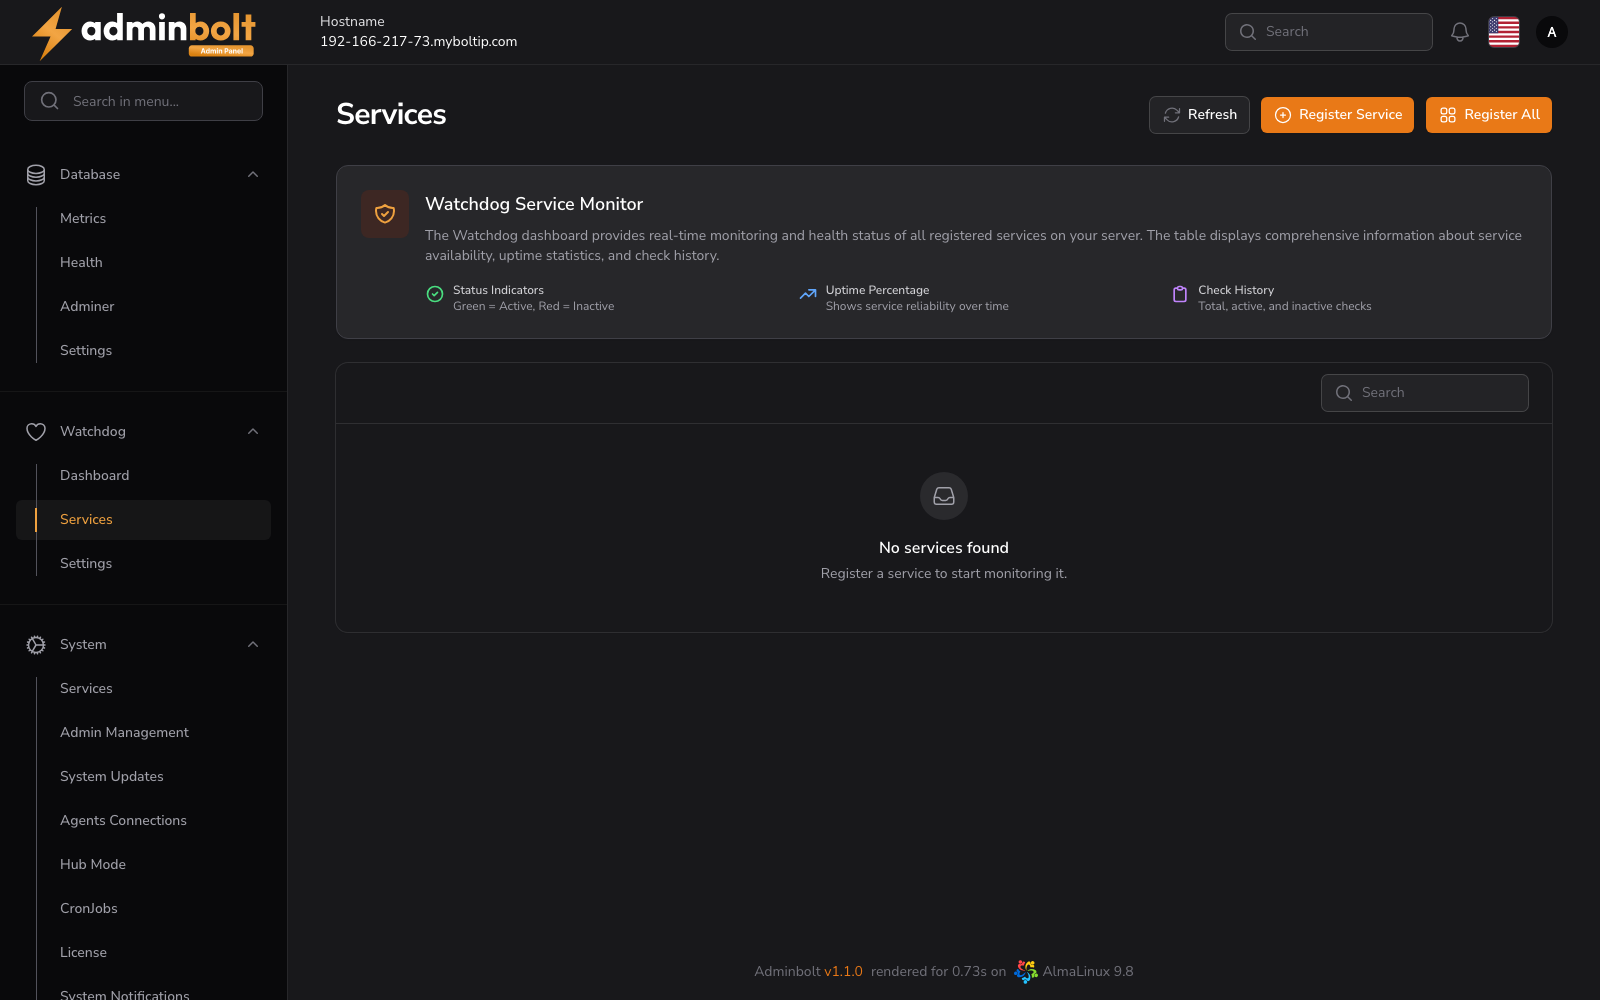
Overview
URL: /admin/watchdog-services
The Watchdog dashboard provides real-time monitoring and health status of all registered services on your server. The table displays comprehensive information about service availability, uptime statistics, and check history.
Actions
- Refresh - Reloads the service status data.
- Register Service - Opens a form to register a new system service for Watchdog monitoring.
- Register All - Bulk-registers all detected system services in a single action.
Indicators
The page header explains the conventions used in the table:
- Status Indicators - Green =
Active, Red =Inactive. - Uptime Percentage - Shows service reliability over time.
- Check History - Total, active, and inactive checks.
Services Table
The table includes the following columns:
- Service Name - Name of the monitored service (e.g.,
httpd,mariadb,redis). - Auto-Restart - Whether the Watchdog will attempt to restart the service automatically if it goes down (
Enabled/Disabled). - Status - Current service state (
Active,Inactive). - Uptime - Uptime percentage over the tracked window.
- Total Checks - Cumulative count of health checks performed.
- Last Checked - Timestamp of the most recent health check.
Search
The Search field filters the list by service name for quick access.
Related Pages
- Watchdog Dashboard - Overview of overall health and monitored services.
- Watchdog Settings - Global Watchdog configuration.