

Access Logs
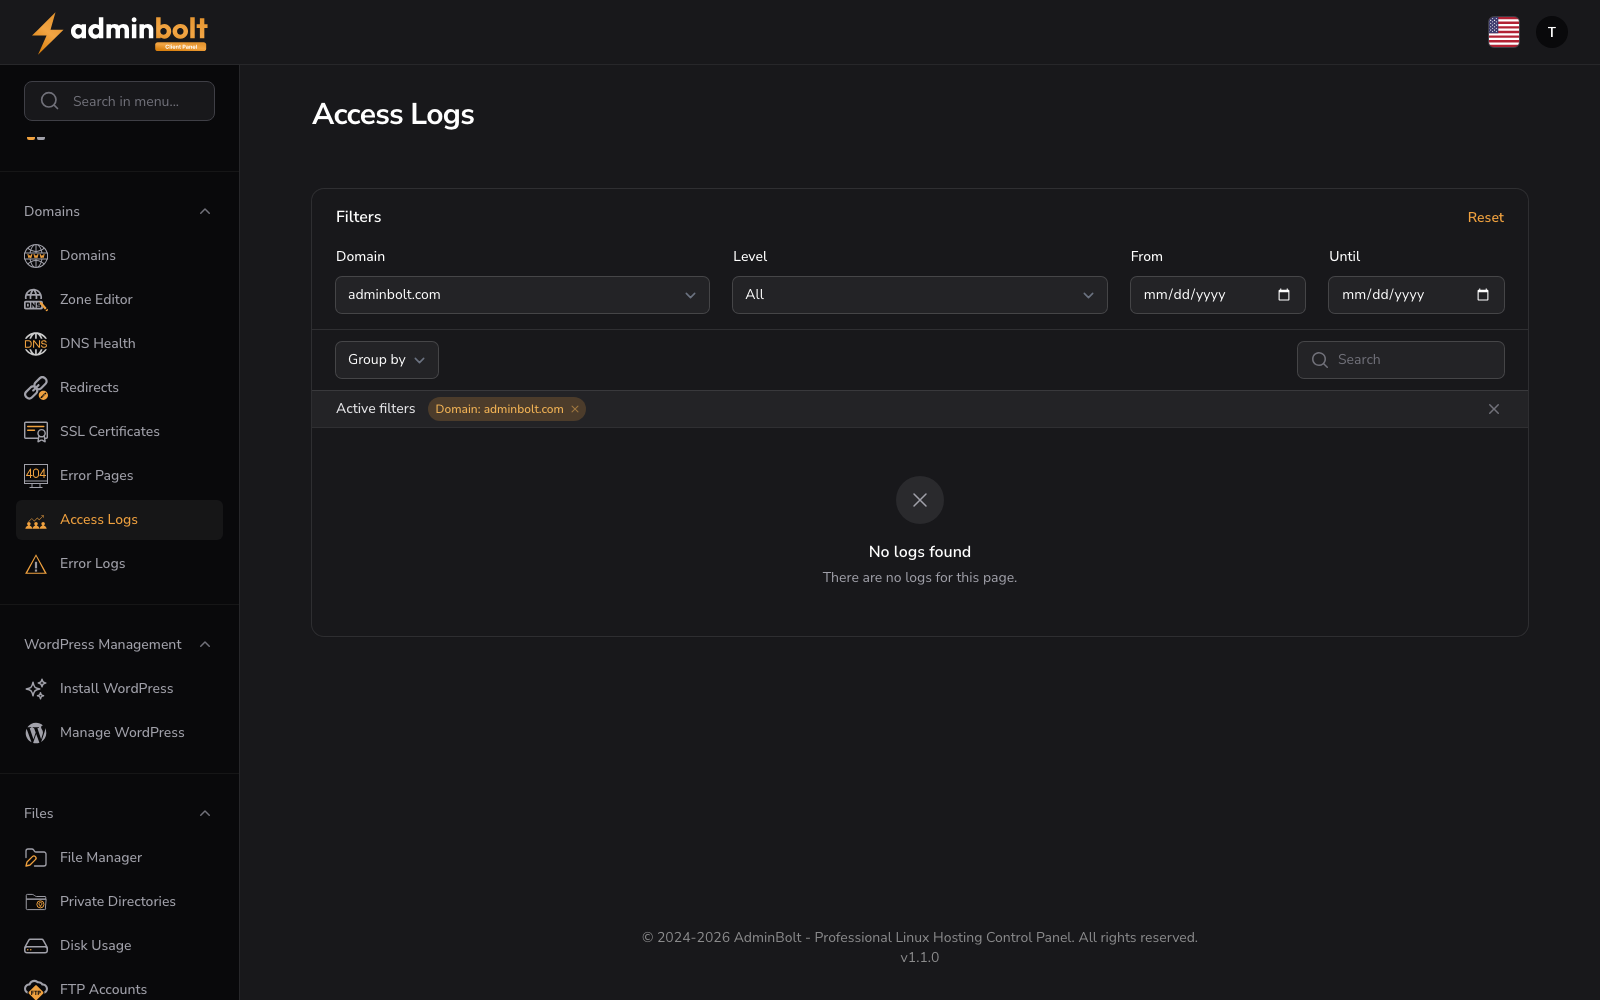
URL: /client/access-logs
Overview
The Access Logs section provides a searchable log of all HTTP requests to your domains, including request details, response status, and timestamps. Use access logs to monitor traffic patterns, debug requests, and analyze visitor activity.
Interface Elements
Filter Section
- Domain - Filter logs by specific domain
- Level - Select log severity: All, EMERGENCY, ALERT, CRITICAL, ERROR, WARNING, NOTICE, INFO, or DEBUG
- From - Start date for log range
- Until - End date for log range
- Reset button - Clear all active filters
Organization
- Group by - Domain
- Group direction - Ascending or Descending
Search and Display
- Search bar - Query logs by keyword
- Active filters display - Shows applied filters with Remove buttons
- Per page selector - Display 5, 10, 25, 50, or all entries
- Pagination - Navigate through log pages
Table Columns
| Column | Description |
|---|---|
| Domain | Domain name (sortable) |
| Time | Request timestamp |
| Remote Host | The visitor address the server recorded for the request |
| Module | Processing module or service |
| Level | Log severity level |
| Message | Request or response details |
The Remote Host column was added in AdminBolt 1.7.0. When your site is served through a CDN and the server administrator has configured remote IP handling, this column shows the visitor's own address rather than the CDN's.