

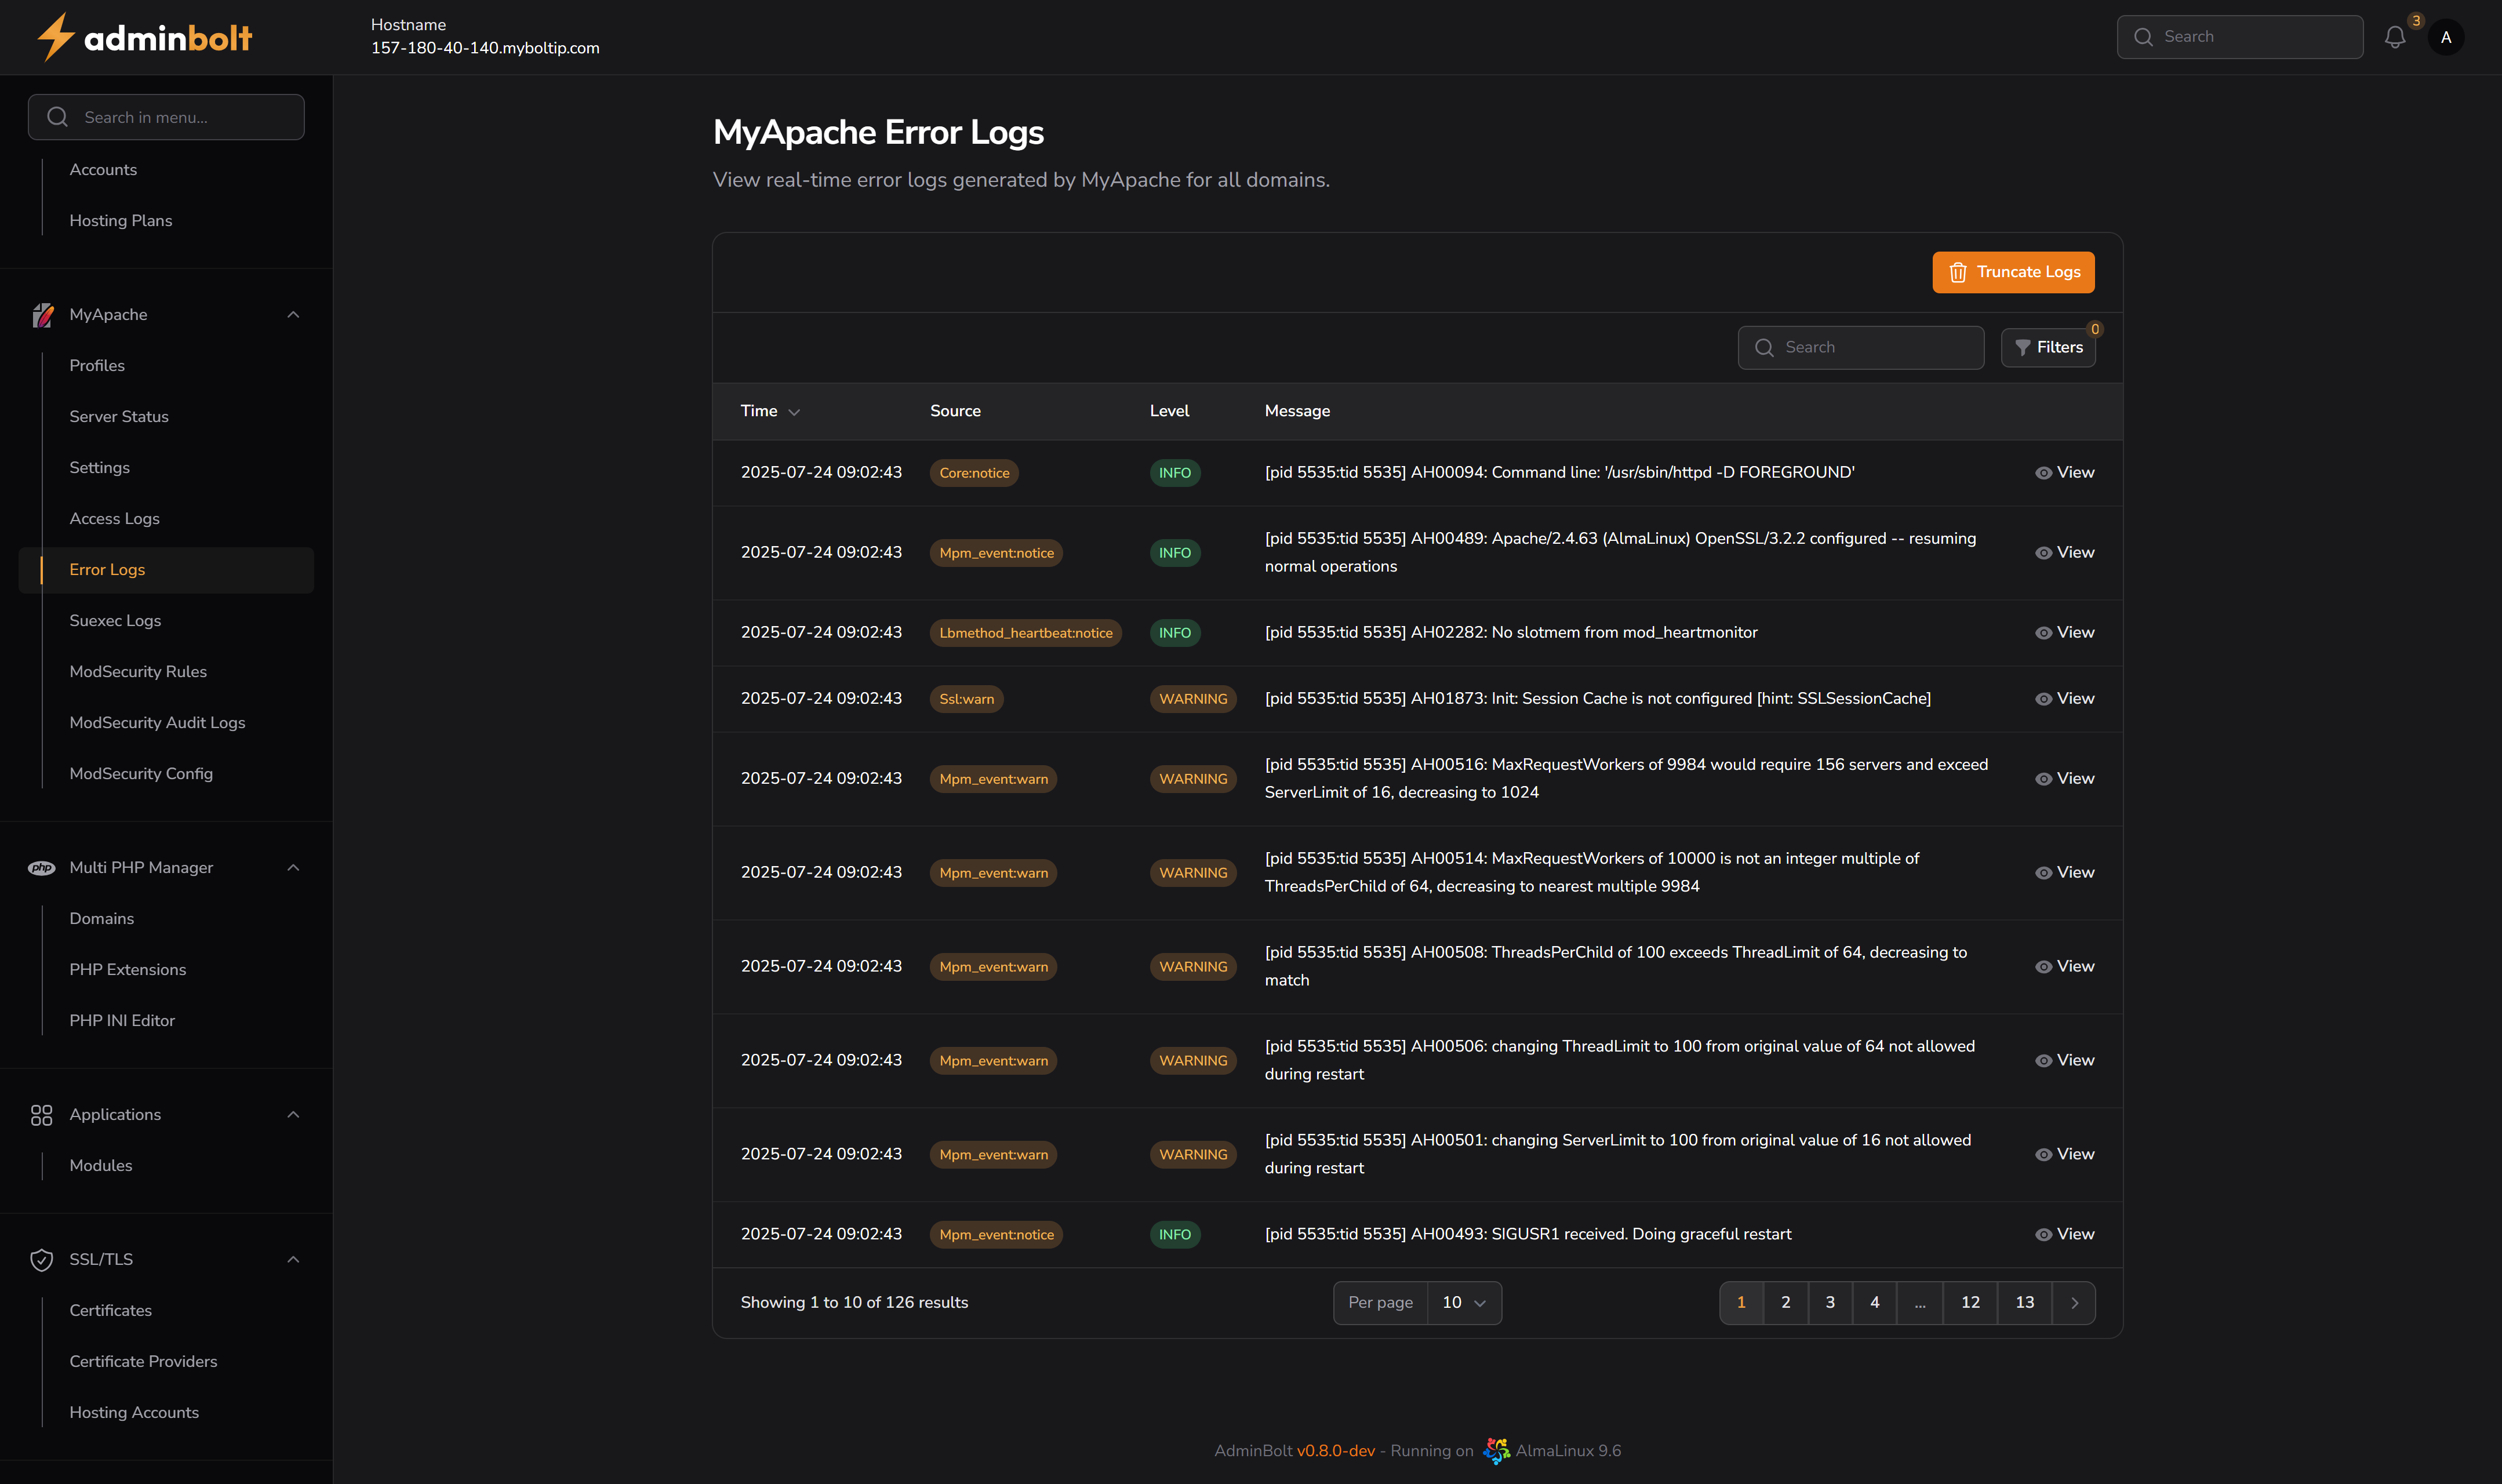
MyApache Error Logs
The MyApache Error Logs page provides a real-time view of all error messages generated by the Apache service (MyApache) across all domains.
Overview
URL: /admin/my-apache-error-logs
This section allows administrators to monitor critical warnings and informational messages from Apache. It helps in identifying misconfigurations, system limits, module behavior, and runtime issues.
Interface Elements
Search and Filters
Located at the top right above the log table:
- Search Bar – Search log entries by any keyword (e.g., PID, module, AH code).
- Filters Panel (via the Filters button):
- Source – Filter logs by Apache module (e.g.,
Ssl:warn,Core:notice, etc.). - Level – Filter logs by severity level (
INFO,WARNING, etc.). - Date Range – Set
FromandUntilfields to filter logs by date/time.
- Source – Filter logs by Apache module (e.g.,
Log Table
| Column | Description |
|---|---|
| Time | Timestamp when the error was generated. |
| Source | Apache module or component that triggered the message. |
| Level | Log severity level (e.g., INFO, WARNING). |
| Message | Full error message output from Apache including PID, thread ID, and AH code. |
| View | Button to open detailed log in a modal window. |
Actions
Truncate Logs
- Orange button at the top-right.
- Clears all current error log entries.
- Action requires confirmation.
Pagination
Located at the bottom of the table:
- Choose number of results per page (10, 25, 50, All).
- Navigate through multiple pages of logs.
View Details Modal
Each log entry includes a View button (eye icon) that opens a modal with complete details:
- Created at – Exact time of log generation.
- Source – Apache component or module.
- Level – Log severity level.
- Message – Full Apache log content including configuration hints or system warnings.
Notes
- Logs are collected in real time from Apache system output.
- Useful for debugging misconfigured directives, performance tuning, or module-level analysis.
- Filtering by source or level helps isolate specific Apache concerns.