

Error Log
The Error Log page allows administrators to view, filter, search, and clear system error logs.
Overview
URL: /admin/error-log
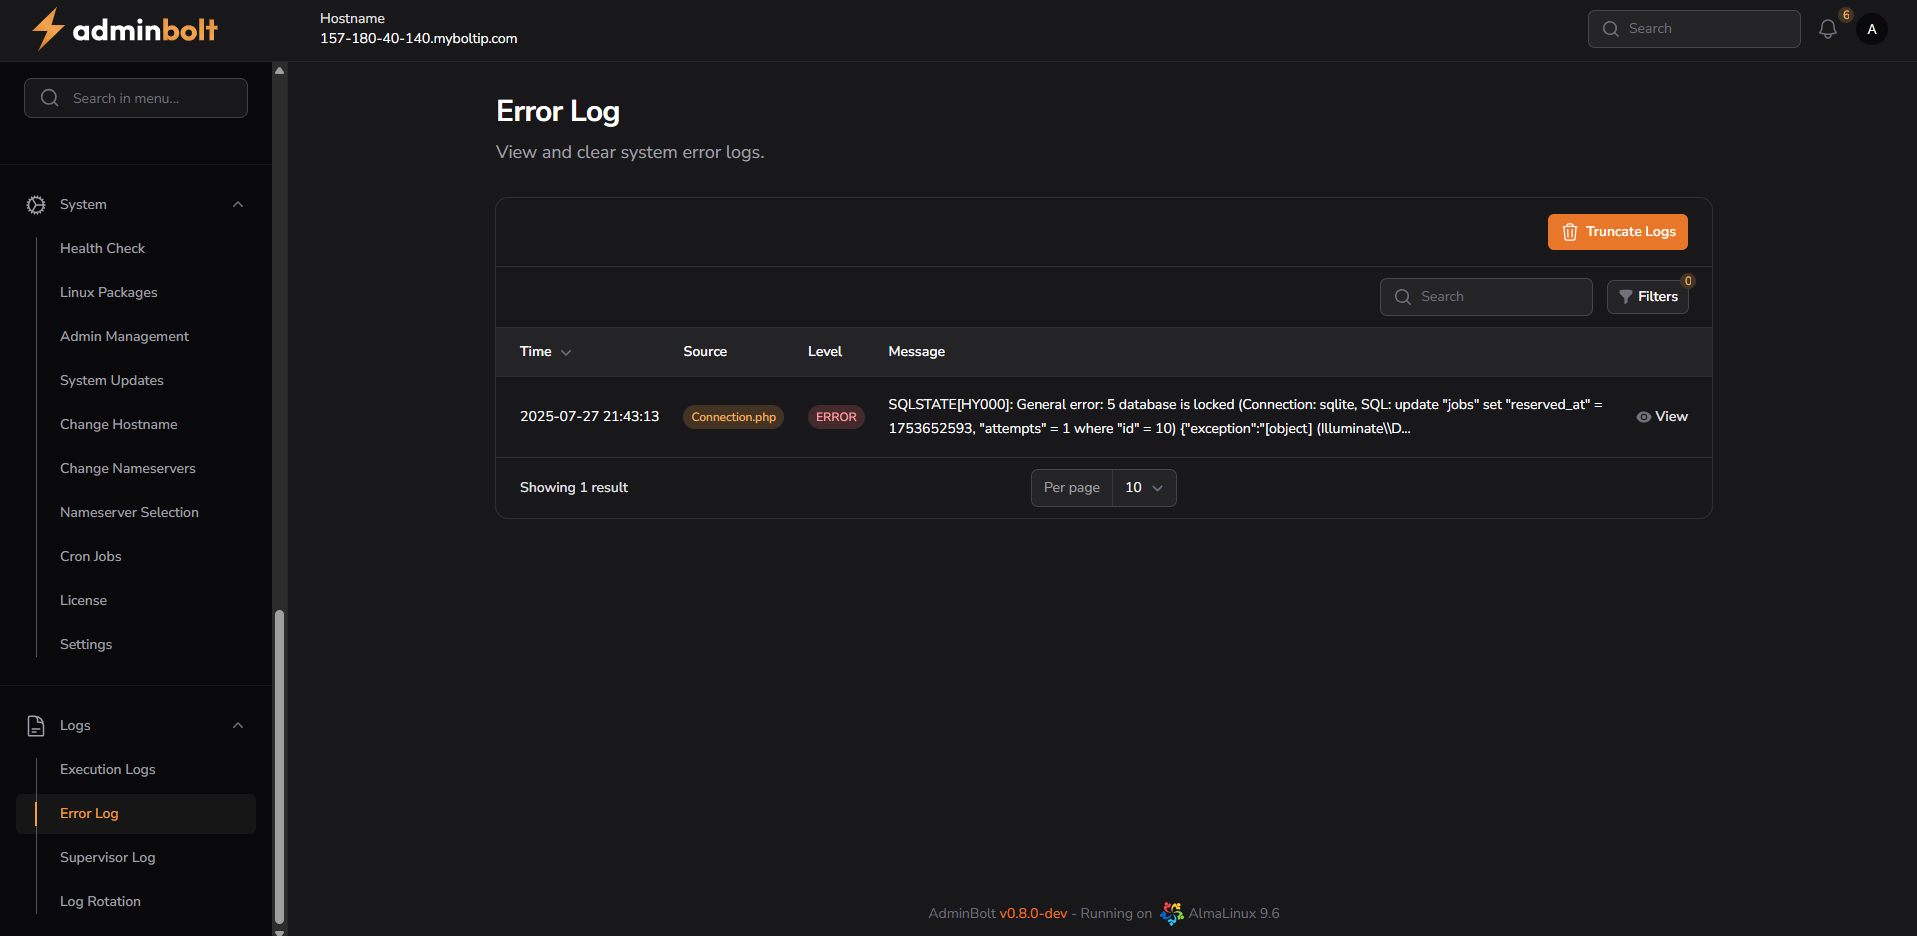
This page lists all recorded error log entries in a table format with the following columns:
- Time – Timestamp when the error occurred
- Source – File or component where the error originated
- Level – Severity level (e.g. ERROR, WARNING, INFO, etc.)
- Message – The actual log message (truncated in table, full view available)
You can click the View button to see the complete error log in detail:
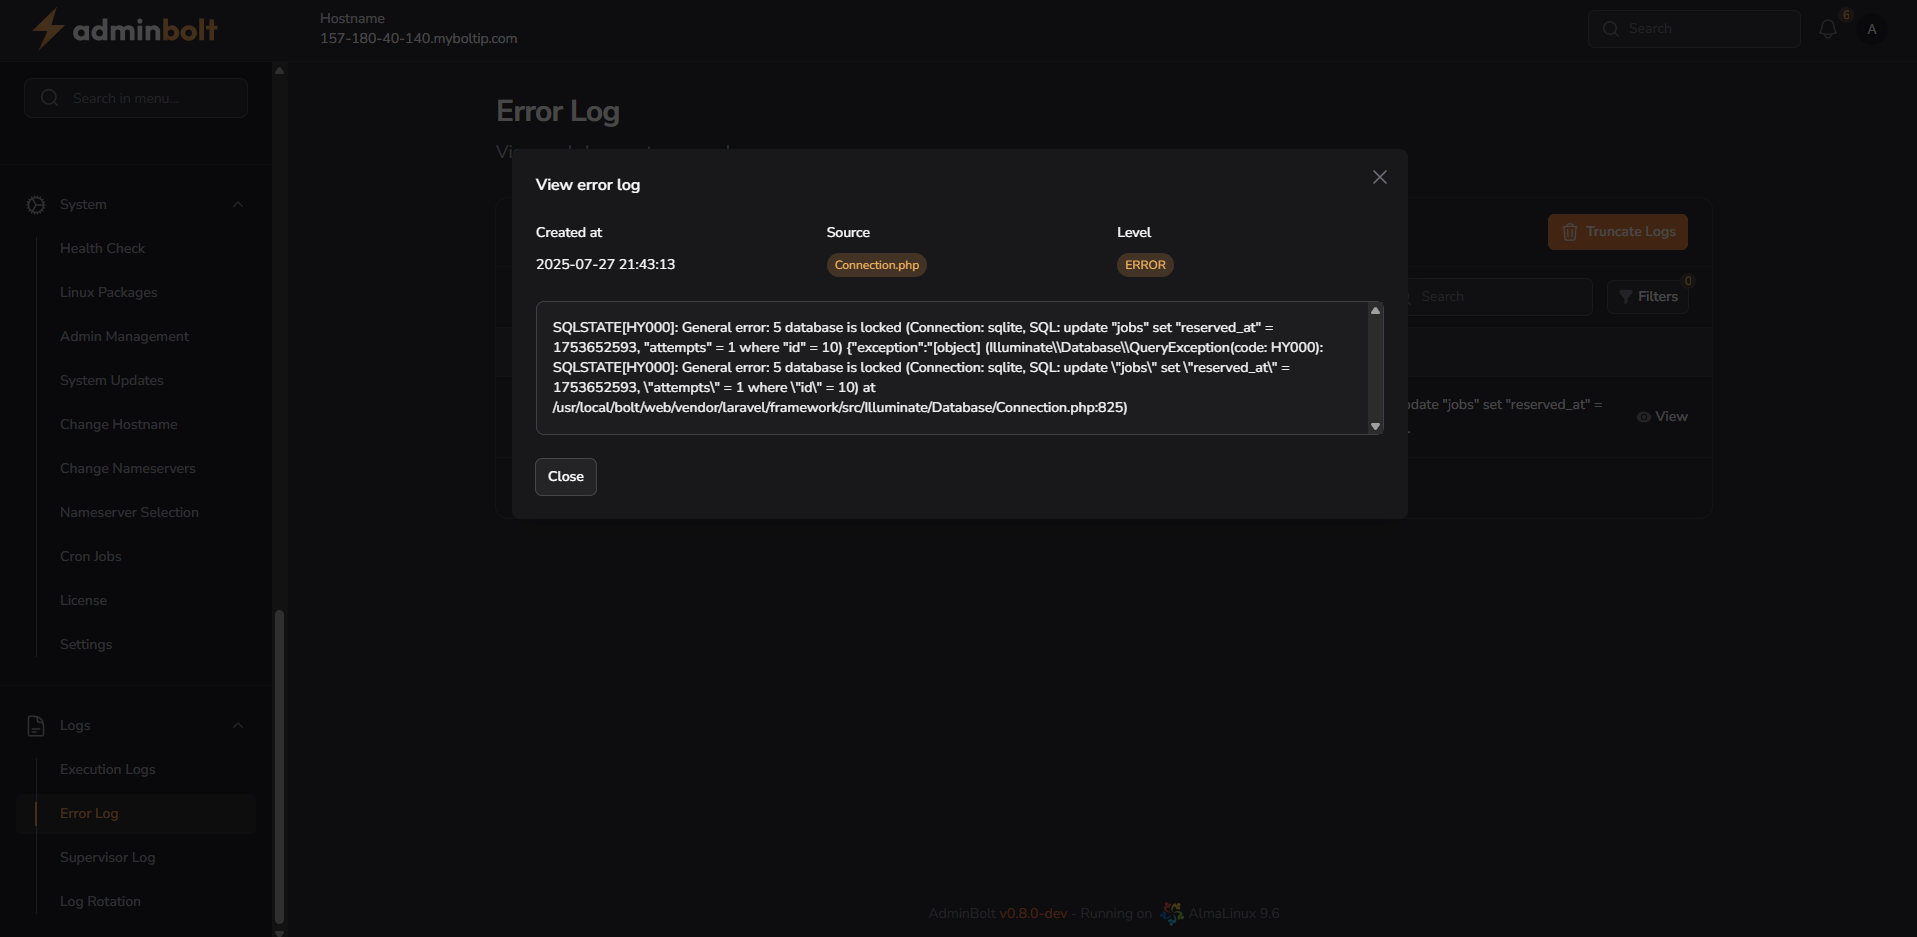
The detail view includes:
- Created at (timestamp)
- Source (e.g. Connection.php)
- Level (e.g. ERROR)
- Full Message in scrollable text area
Search
The search bar above the table allows filtering logs by:
- Time
- Source
- Level
- Message
Filters
Clicking the Filters button opens a panel with the following options:
Level – Filter by severity level:
- All
- EMERGENCY
- ALERT
- CRITICAL
- ERROR
- WARNING
- NOTICE
- INFO
- DEBUG
Date Range – Filter logs by specific time window:
- From – Start date
- Until – End date
The Reset button clears all filter selections.
Pagination
Pagination options are available at the bottom of the table. You can choose how many log entries to display per page:
- 5
- 10
- 25
- 50
- All
Truncating Logs
To delete all error logs from the system, click the Truncate Logs button in the top right corner. This action is irreversible.