

MyApache Server Status
The MyApache Server Status page provides real-time system metrics and Apache process details for performance monitoring and diagnostics.
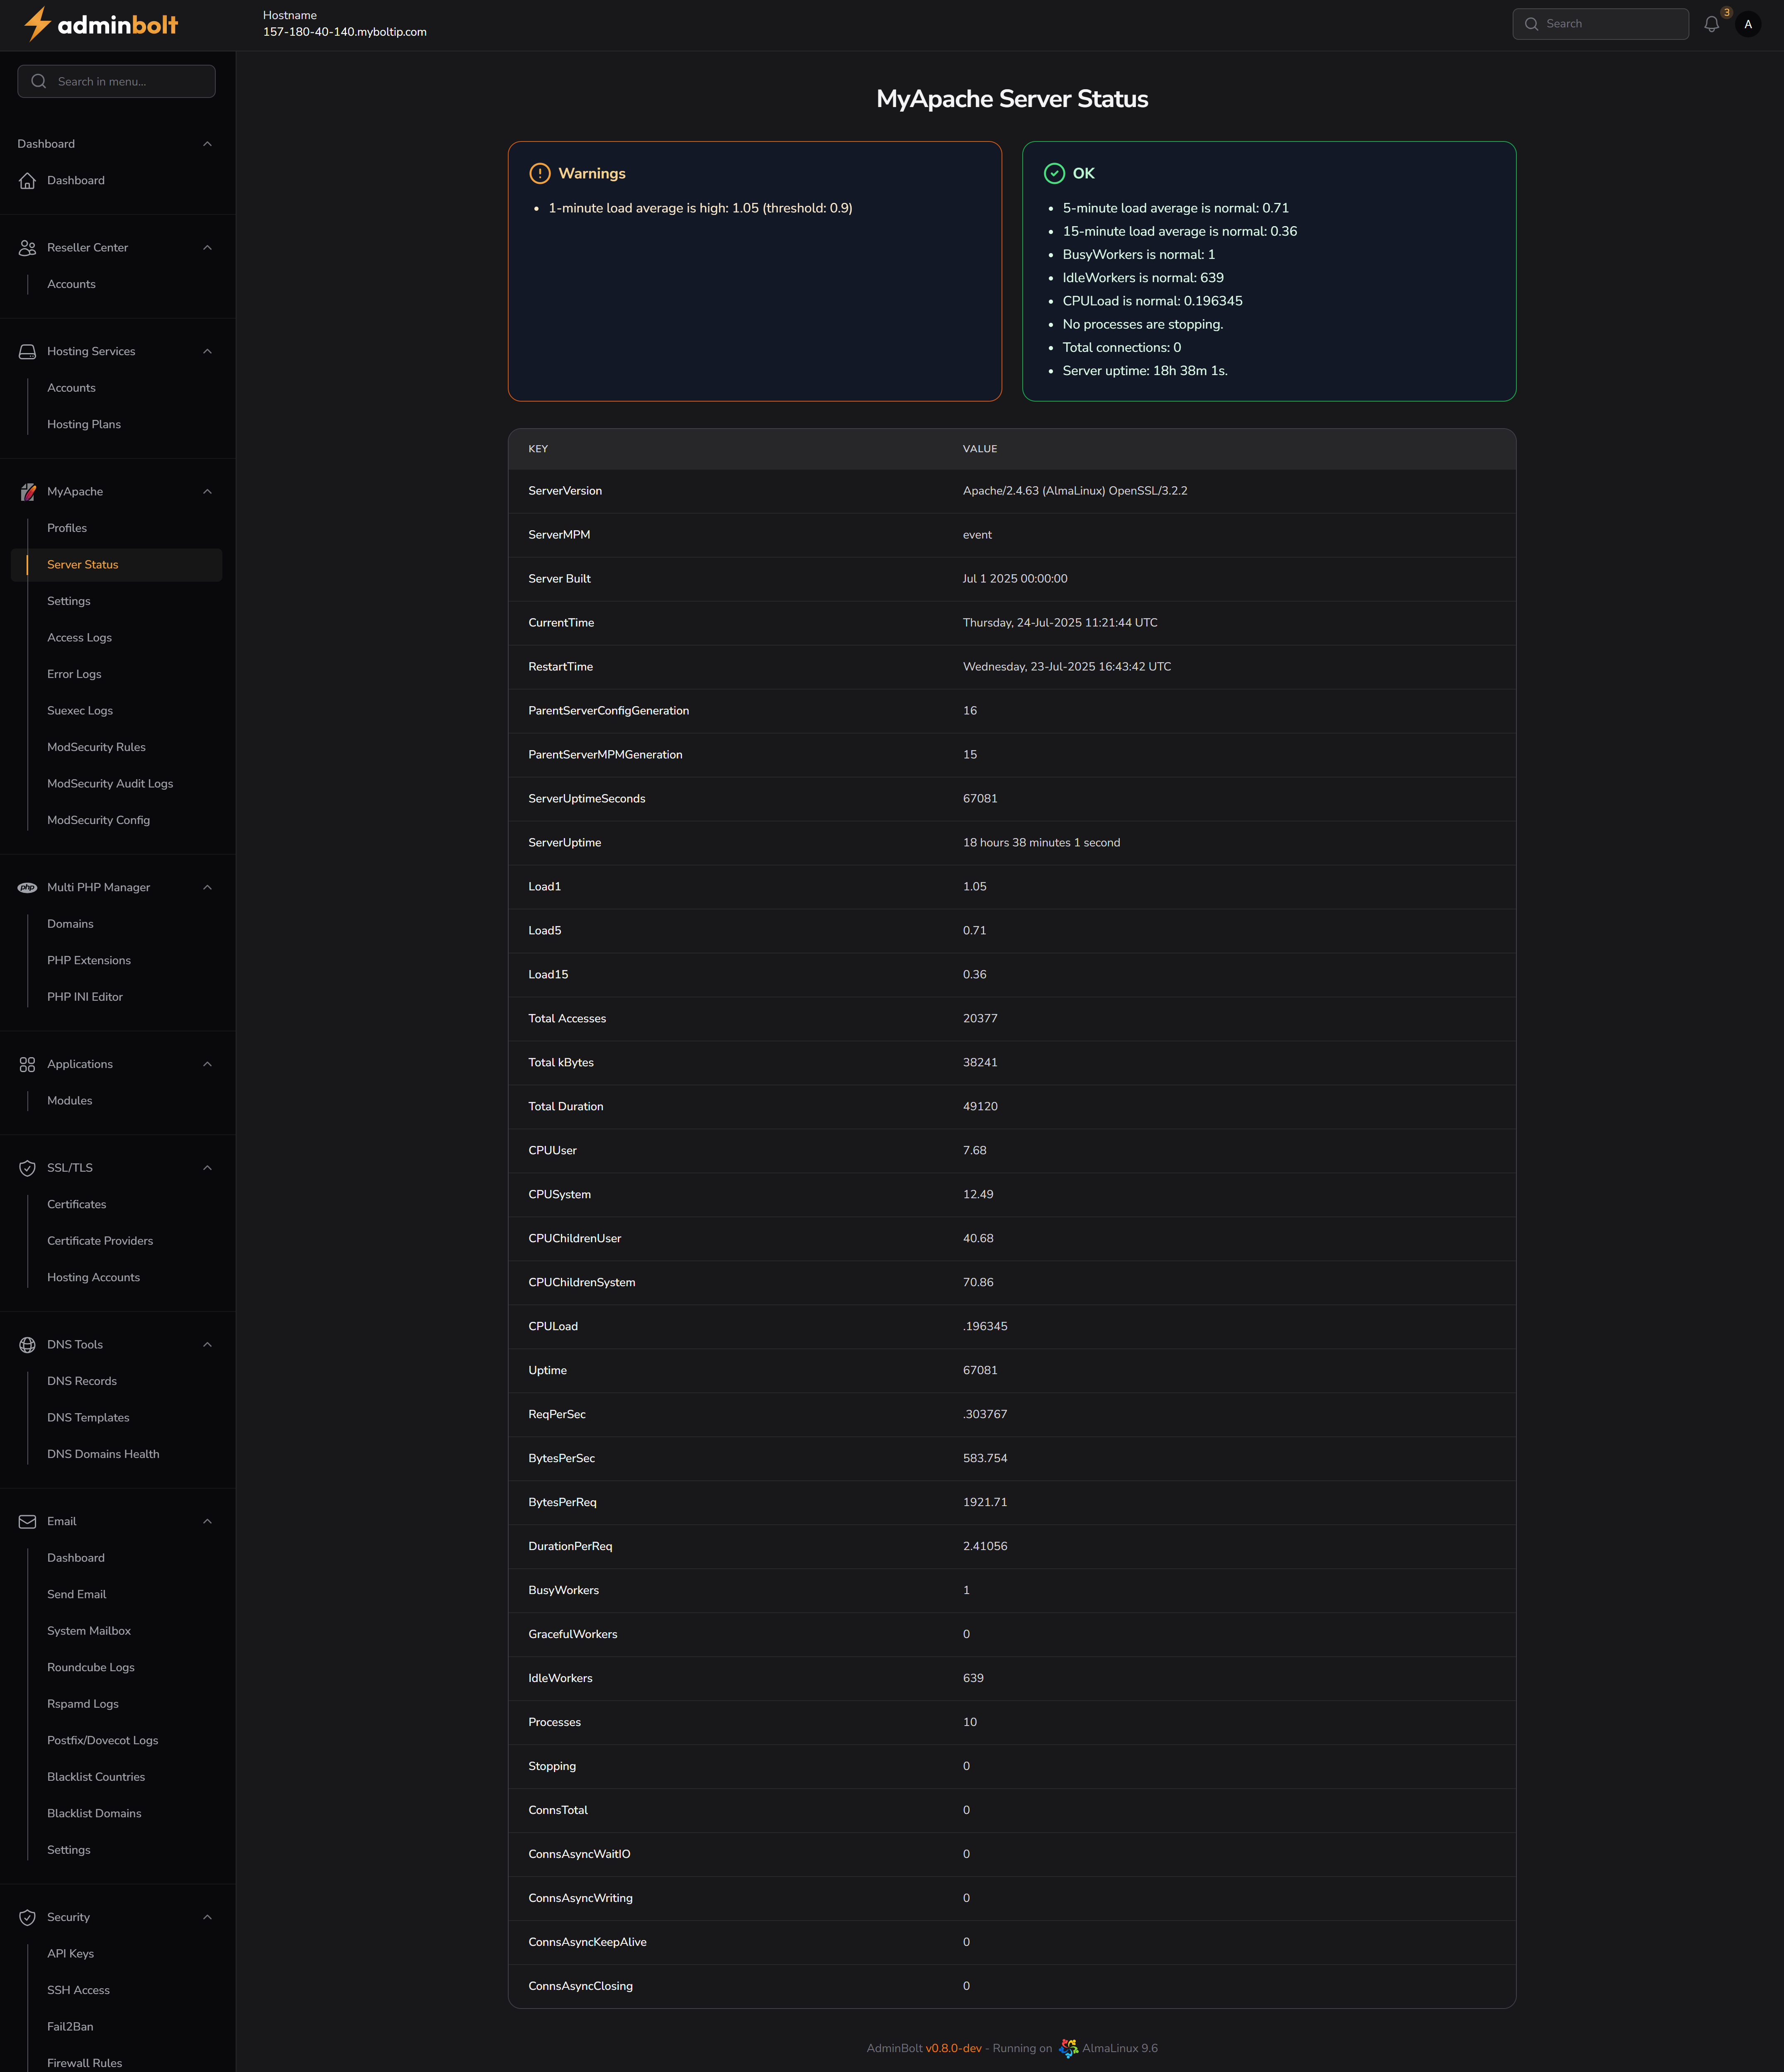
Overview
URL: /admin/my-apache-server-status
This page displays:
- System warnings and health indicators based on current Apache performance
- A detailed table of key Apache metrics and values
Status Panels
Two panels provide quick server health overview:
Warnings
Displayed if any metric exceeds predefined thresholds.
Example:
- 1-minute load average is high:
1.05(threshold:0.9)
System Health
Shown when server is operating within normal parameters.
Includes:
- Load averages (1m, 5m, 15m)
- Active workers (BusyWorkers, IdleWorkers)
- CPU Load
- Total connections
- Server uptime
Metric Table
| Key | Description |
|---|---|
| ServerVersion | Apache version and loaded modules |
| ServerMPM | Multi-Processing Module type (e.g., event, prefork, worker) |
| Server Built | Date and time when Apache was compiled |
| CurrentTime | Current server time in UTC |
| RestartTime | Timestamp of last Apache restart |
| ParentServerConfigGeneration | Generation number of configuration restarts |
| ParentServerMPMGeneration | MPM generation number |
| ServerUptimeSeconds | Apache uptime in seconds |
| ServerUptime | Apache uptime in human-readable format |
| Load1 | 1-minute system load average |
| Load5 | 5-minute system load average |
| Load15 | 15-minute system load average |
| Total Accesses | Total number of HTTP requests served |
| Total kBytes | Total amount of data transferred in kilobytes |
| Total Duration | Total duration of all served requests |
| CPUUser | CPU time spent in user mode |
| CPUSystem | CPU time spent in system mode |
| CPUChildrenUser | CPU time used by Apache child processes (user) |
| CPUChildrenSystem | CPU time used by Apache child processes (system) |
| CPULoad | CPU usage as a floating point value |
| Uptime | Duplicate of ServerUptimeSeconds |
| ReqPerSec | Average number of requests per second |
| BytesPerSec | Average number of bytes transferred per second |
| BytesPerReq | Average number of bytes per HTTP request |
| DurationPerReq | Average duration per request |
| BusyWorkers | Number of currently active workers |
| GracefulWorkers | Number of gracefully closing workers |
| IdleWorkers | Number of idle workers ready to serve |
| Processes | Total Apache processes running |
| Stopping | Number of processes in stopping state |
| ConnsTotal | Total number of current connections |
| ConnsAsyncWaitIO | Connections in async wait I/O state |
| ConnsAsyncWriting | Connections actively writing responses |
| ConnsAsyncKeepAlive | Connections in keep-alive state |
| ConnsAsyncClosing | Connections in process of closing |