

Admin Dashboard – adminbolt Admin Panel
The Admin Dashboard provides a real-time overview of your system's performance, account statistics, and quick access to main management tools.
Overview
URL: /admin/dashboard
Interface Description
- Header: Hostname (top bar), Global search, Open notifications, User menu (avatar).
- Welcome banner: Logo, Welcome to Adminbolt, tagline Deploy Your Web Hosting Empire in Minutes, short description, and four highlights (Full Control, Secure & Reliable, Easy Management, Multi-server Architecture). Close button to dismiss.
- Quick Actions (links): New Account, All Accounts (hosting-accounts), DNS Records, Resellers, Metrics, SSL Certificates.
- Stats cards: Hosting Accounts, Domains, Databases, Resellers (with counts).
- System Information: Hostname, Platform, Uptime, CPU Cores, Memory Usage (e.g. X GB / Y GB, percentage), link View Detailed Metrics → (to Metrics).
- Recent Accounts: List of recent hosting accounts with domain and user; View All link to hosting-accounts.
- Management Tools (links): Hosting Plans, Cron Jobs, Firewall Rules, Fail2Ban, PHP Versions, MyApache Profiles, Linux Users, Execution Logs.
- Sidebar: Full menu (Home, Reseller Center, Hosting Services, MyApache, Multi PHP Manager, Applications, SSL/TLS, DNS Tools, Email, Infrastructure, Security, Fail2Ban, Vsftpd, Database, System, Logs).
- Footer: adminbolt version (link to change-log), platform (e.g. AlmaLinux).
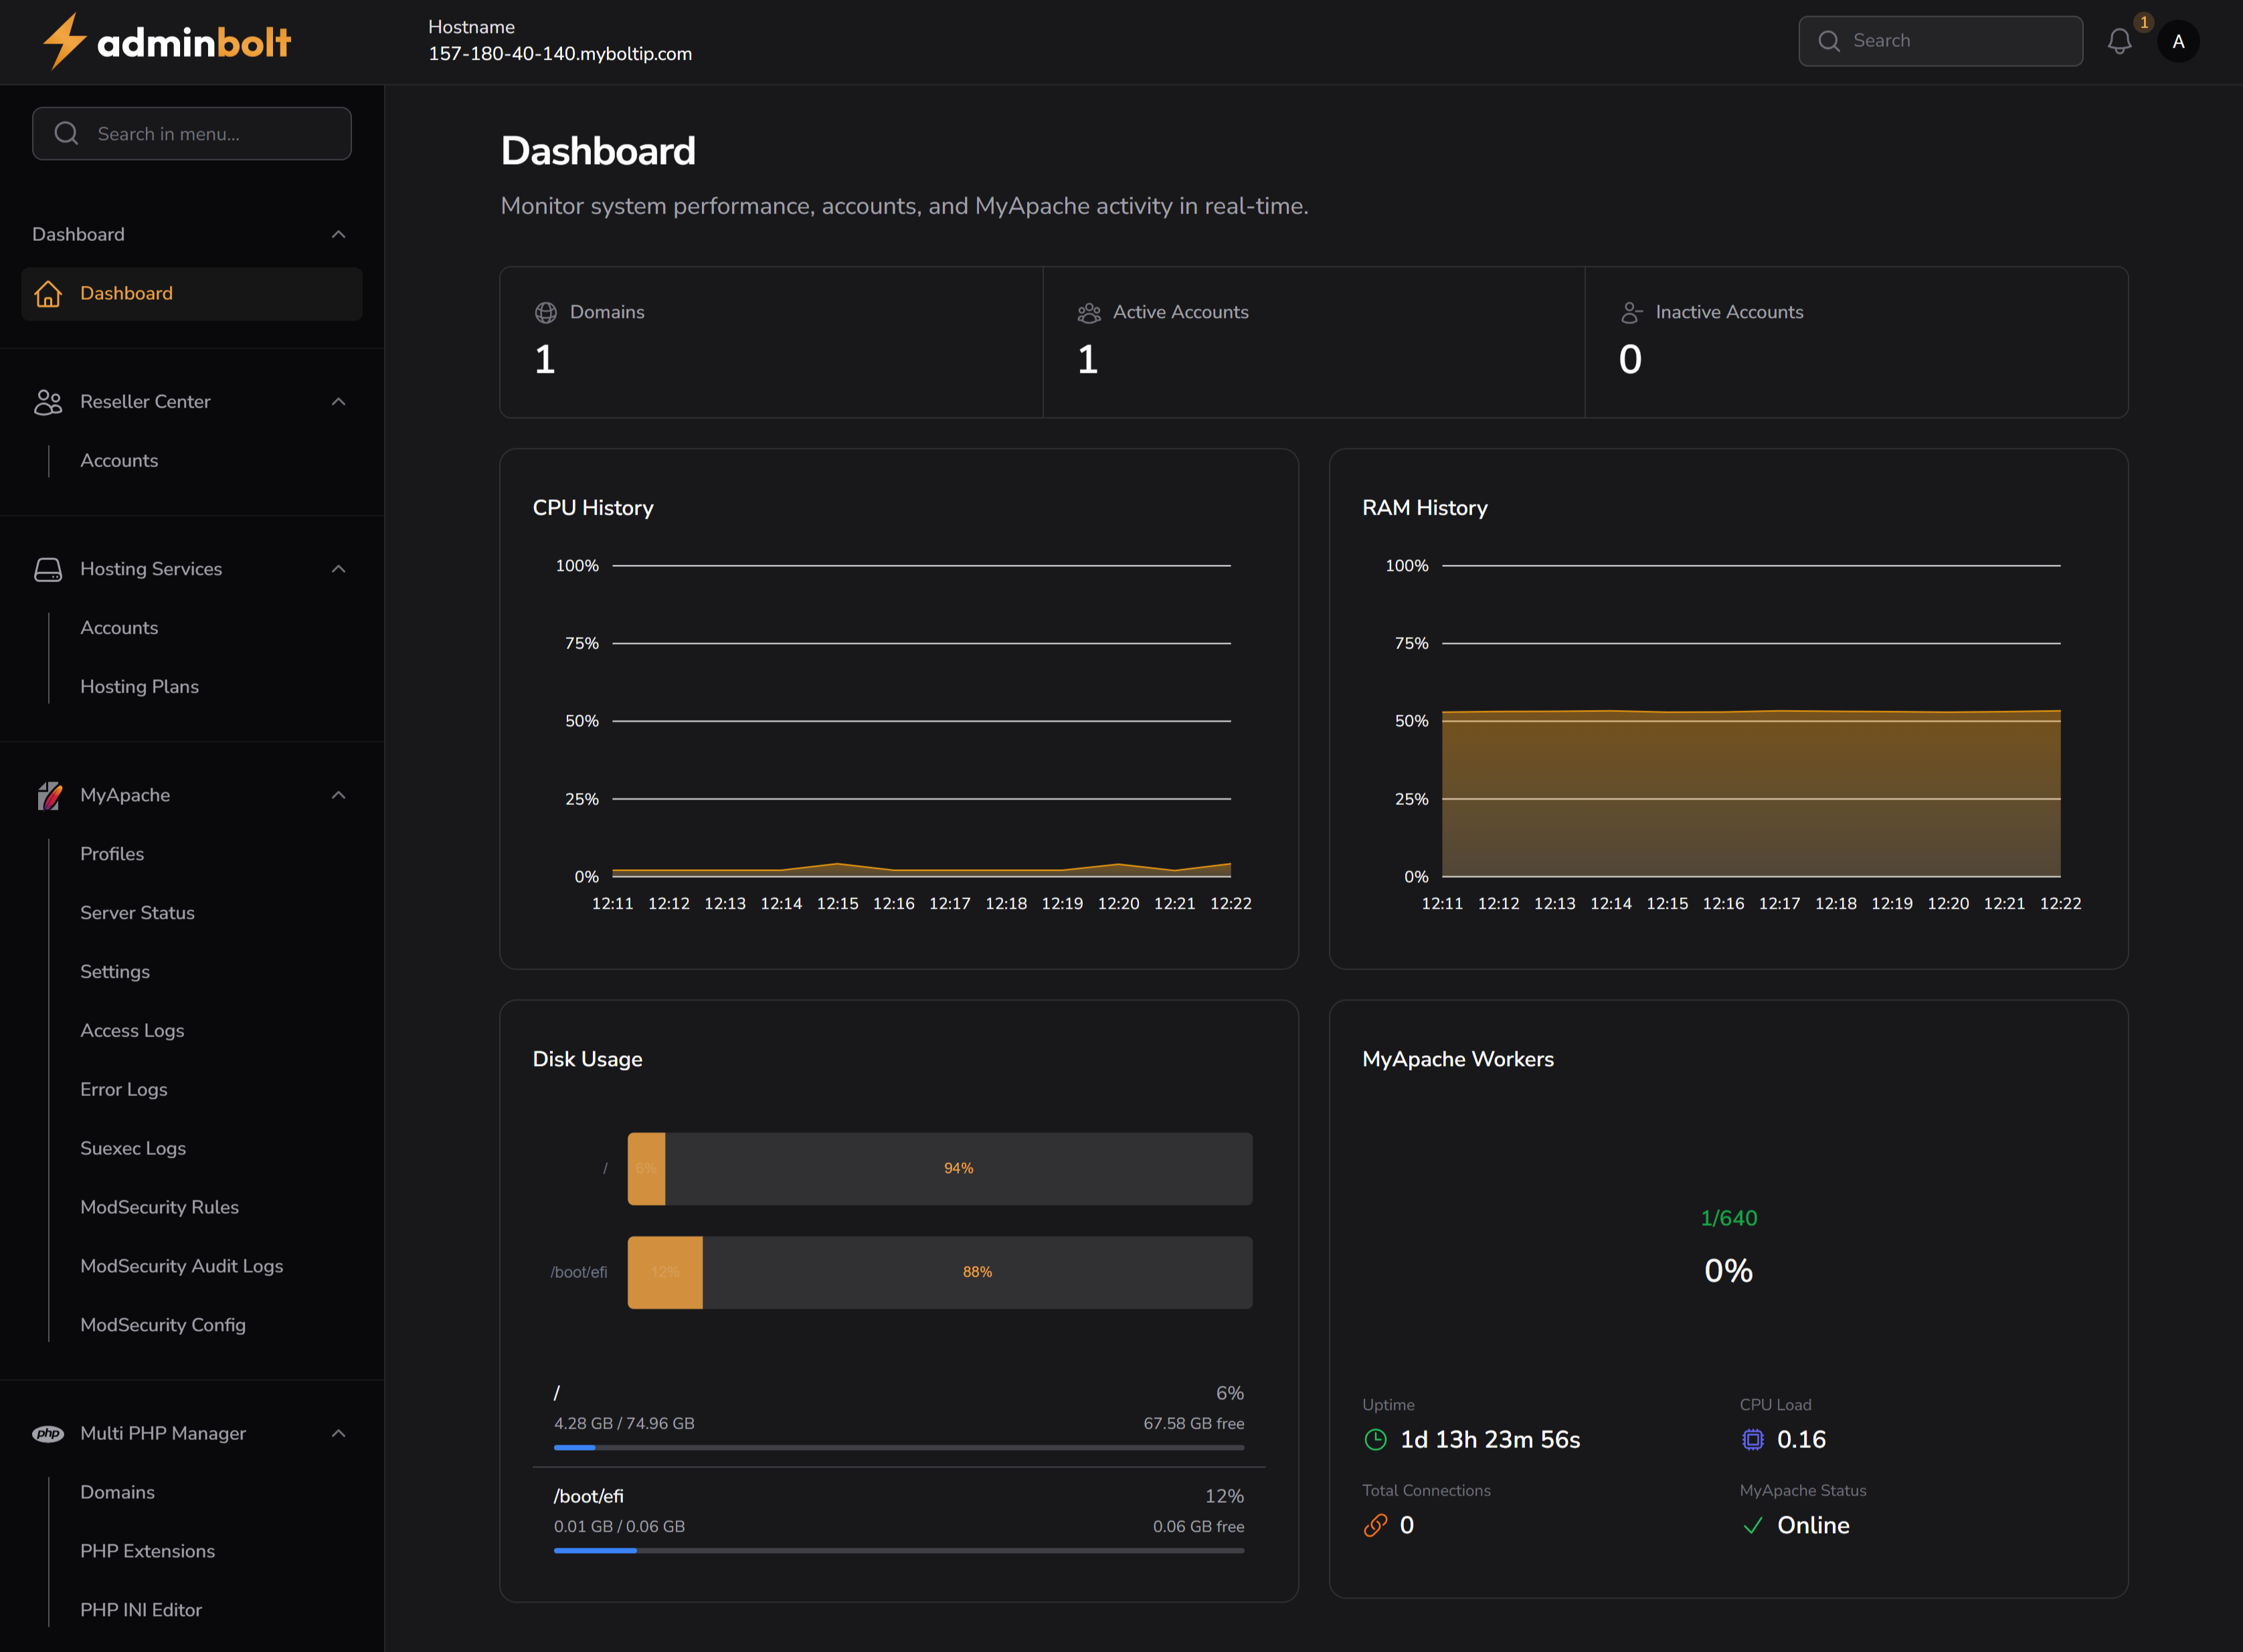
Quick Stats (typical)
- Domains - Total number of hosted domains
- Active Accounts - Number of currently active hosting accounts
- Inactive Accounts - Number of currently inactive accounts
Resource Usage
- CPU History - Graphical view of CPU load over time
- RAM History - Visual chart of RAM utilization trends
- Disk Usage - Displays disk usage per mount point and usage percentage
MyApache Overview
- MyApache Workers - Shows the number of currently active Apache workers
- Uptime - Duration since the last server restart
- CPU Load - Current load on the server
- Total Connections - Number of active connections to MyApache
- Status - MyApache service status (e.g., Online/Offline)
System Information
The dashboard shows hostname, platform, uptime, CPU cores, memory usage, and a link to detailed metrics. The footer shows the adminbolt version and operating system.