

App Health
App Health provides real-time monitoring and performance insights for your application cache, exceptions, requests, and usage metrics.
App Health Overview
URL: /admin/app-health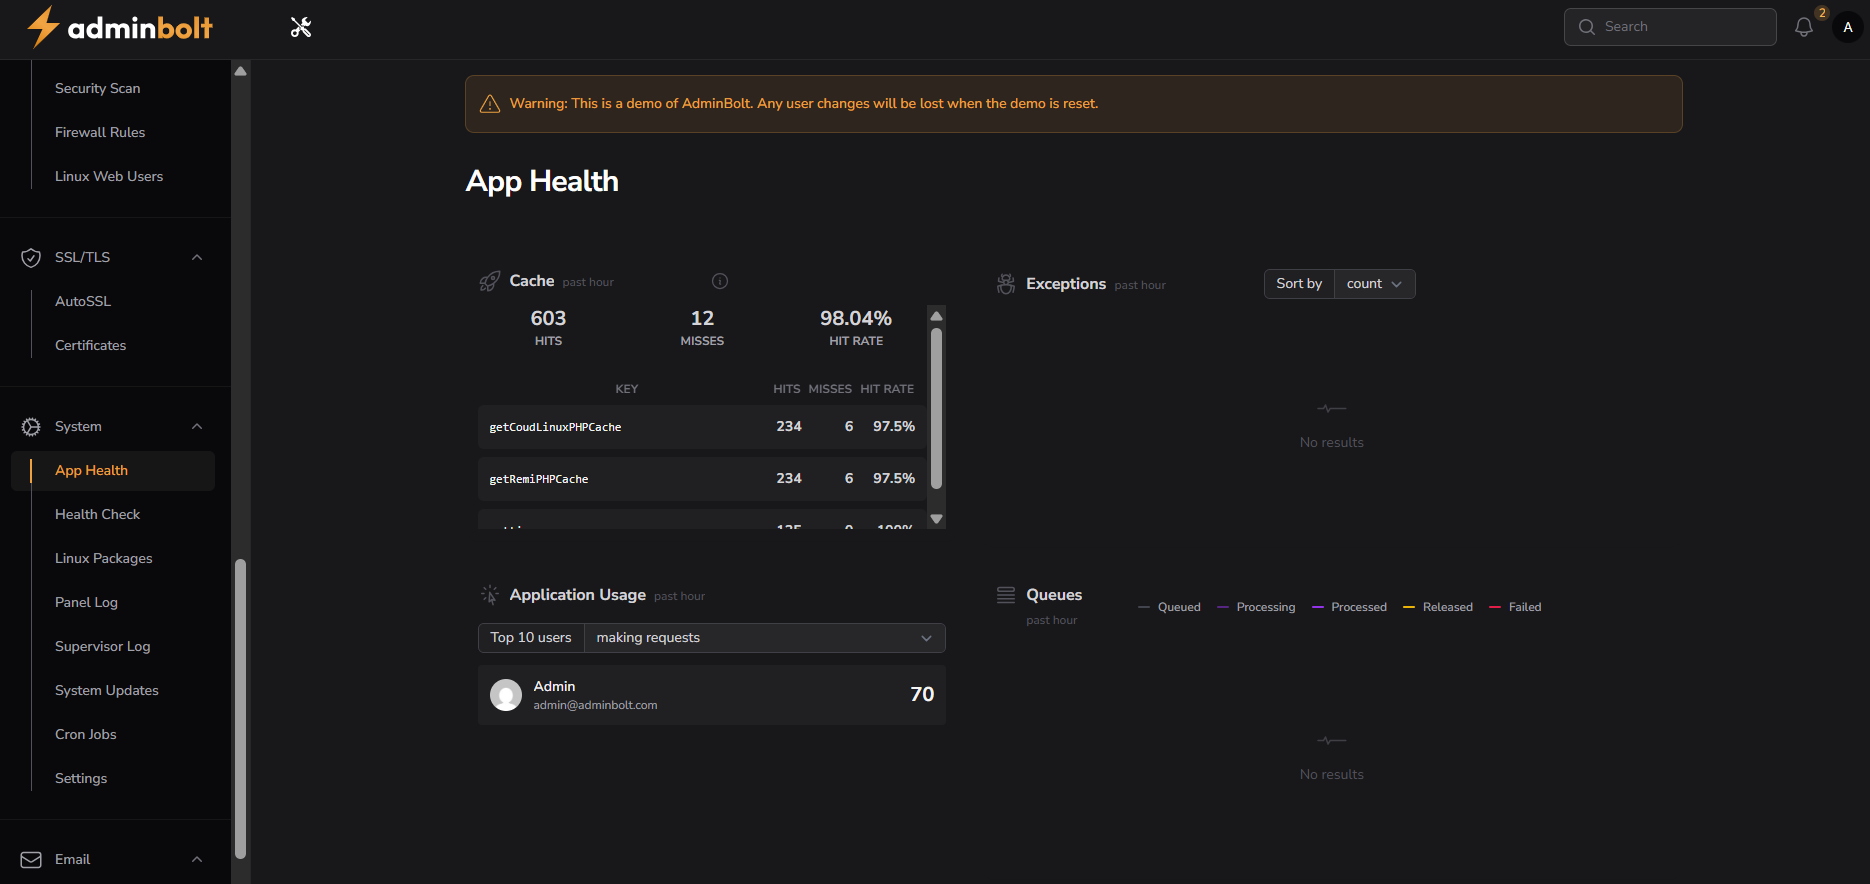
Interface Elements
Cache Performance
- Hits Counter: 603 successful cache retrievals (past hour)
- Misses Counter: 12 failed cache retrievals (past hour)
- Hit Rate: 98.04% success rate for cache operations
Cache Detail Table
- Key Column: Cache function identifiers
- Hits Column: Successful retrievals per function
- Misses Column: Failed retrievals per function
- Hit Rate Column: Success percentage per function
Application Usage
- User Activity Tracker: Shows top users by request volume
- Request Counter: Displays number of requests per user
- User Information: Shows user email and identification
Exception Monitoring
- Exception Counter: Tracks application errors (past hour)
- Sort Controls: Allows sorting by count or other metrics
- Status Indicator: Shows "No results" when no exceptions exist
Queue Management
- Queue Status Display: Visual representation of processing pipeline
- Queue Types:
- Queued
- Processing
- Processed
- Released
- Failed
Performance Metrics
- Slow Queries: Database queries exceeding 1000ms threshold
- Slow Requests: API requests exceeding 1000ms threshold
- Slow Outgoing Requests: External service calls exceeding 1000ms threshold
Table Details
- Cache Keys: Function names like
getCountLinuxPHPCacheandgetResiPHPCache - Performance: 97.5% hit rate for key cache functions
- Request Data: Admin user with 70 requests in the past hour
Feature Functionality
Cache Monitoring
- Monitor application cache performance
- Track hit rates across key cache functions
- Identify cache inefficiencies
- Optimize application response times
Performance Tracking
- Identify slow queries and requests
- Monitor application usage patterns
- Track user engagement metrics
- Analyze system bottlenecks
Exception Management
- Real-time exception monitoring
- Exception categorization
- Error trend analysis
- Proactive error management
Queue Visualization
- Track job processing status
- Monitor queue health
- Identify processing bottlenecks
- Optimize job processing performance
Navigation Integration
System Menu Structure
- System → App Health
- Integrated with other system monitoring tools
Related Features
- Health Check
- Linux Packages
- Panel Log
- Supervisor Log
- System Updates
- Cron Jobs
- Settings
Best Practices
Performance Optimization
- Regularly review cache hit rates
- Optimize functions with low hit rates
- Monitor slow queries and requests
- Analyze application usage patterns
Exception Handling
- Proactively address recurring exceptions
- Monitor exception trends
- Implement error reduction strategies
- Document exception resolution steps
Troubleshooting
Common Scenarios
- Low cache hit rates
- Slow database queries
- Recurring exceptions
- Queue processing delays
Resolution Steps
- Identify performance bottlenecks
- Review cache implementation
- Optimize database queries
- Refine application code
- Scale resources as needed
System Integration
Complementary Tools
- Works with Health Check
- Integrates with Panel Log
- Supports System Updates
- Compatible with Linux Packages
System Requirements
Prerequisites
- Active adminbolt subscription
- Proper system permissions
- Web application environment
- Network connectivity
Technical Specifications
- Real-time performance monitoring
- Comprehensive exception tracking
- Advanced cache analysis
- Low overhead monitoring
Maintenance Guidelines
Regular Tasks
- Review cache performance weekly
- Analyze slow queries daily
- Address exceptions promptly
- Optimize underperforming functions
Best Practices
- Keep application updated
- Monitor system resources
- Implement performance enhancements
- Maintain detailed error logs
Management Benefits
- Real-time application health insights
- Proactive performance optimization
- Comprehensive error tracking
- Cache efficiency monitoring
- Request performance analysis
- User activity visibility
- Queue processing oversight
- System bottleneck identification