

Visitors – AdminBolt Hosting Panel
Overview
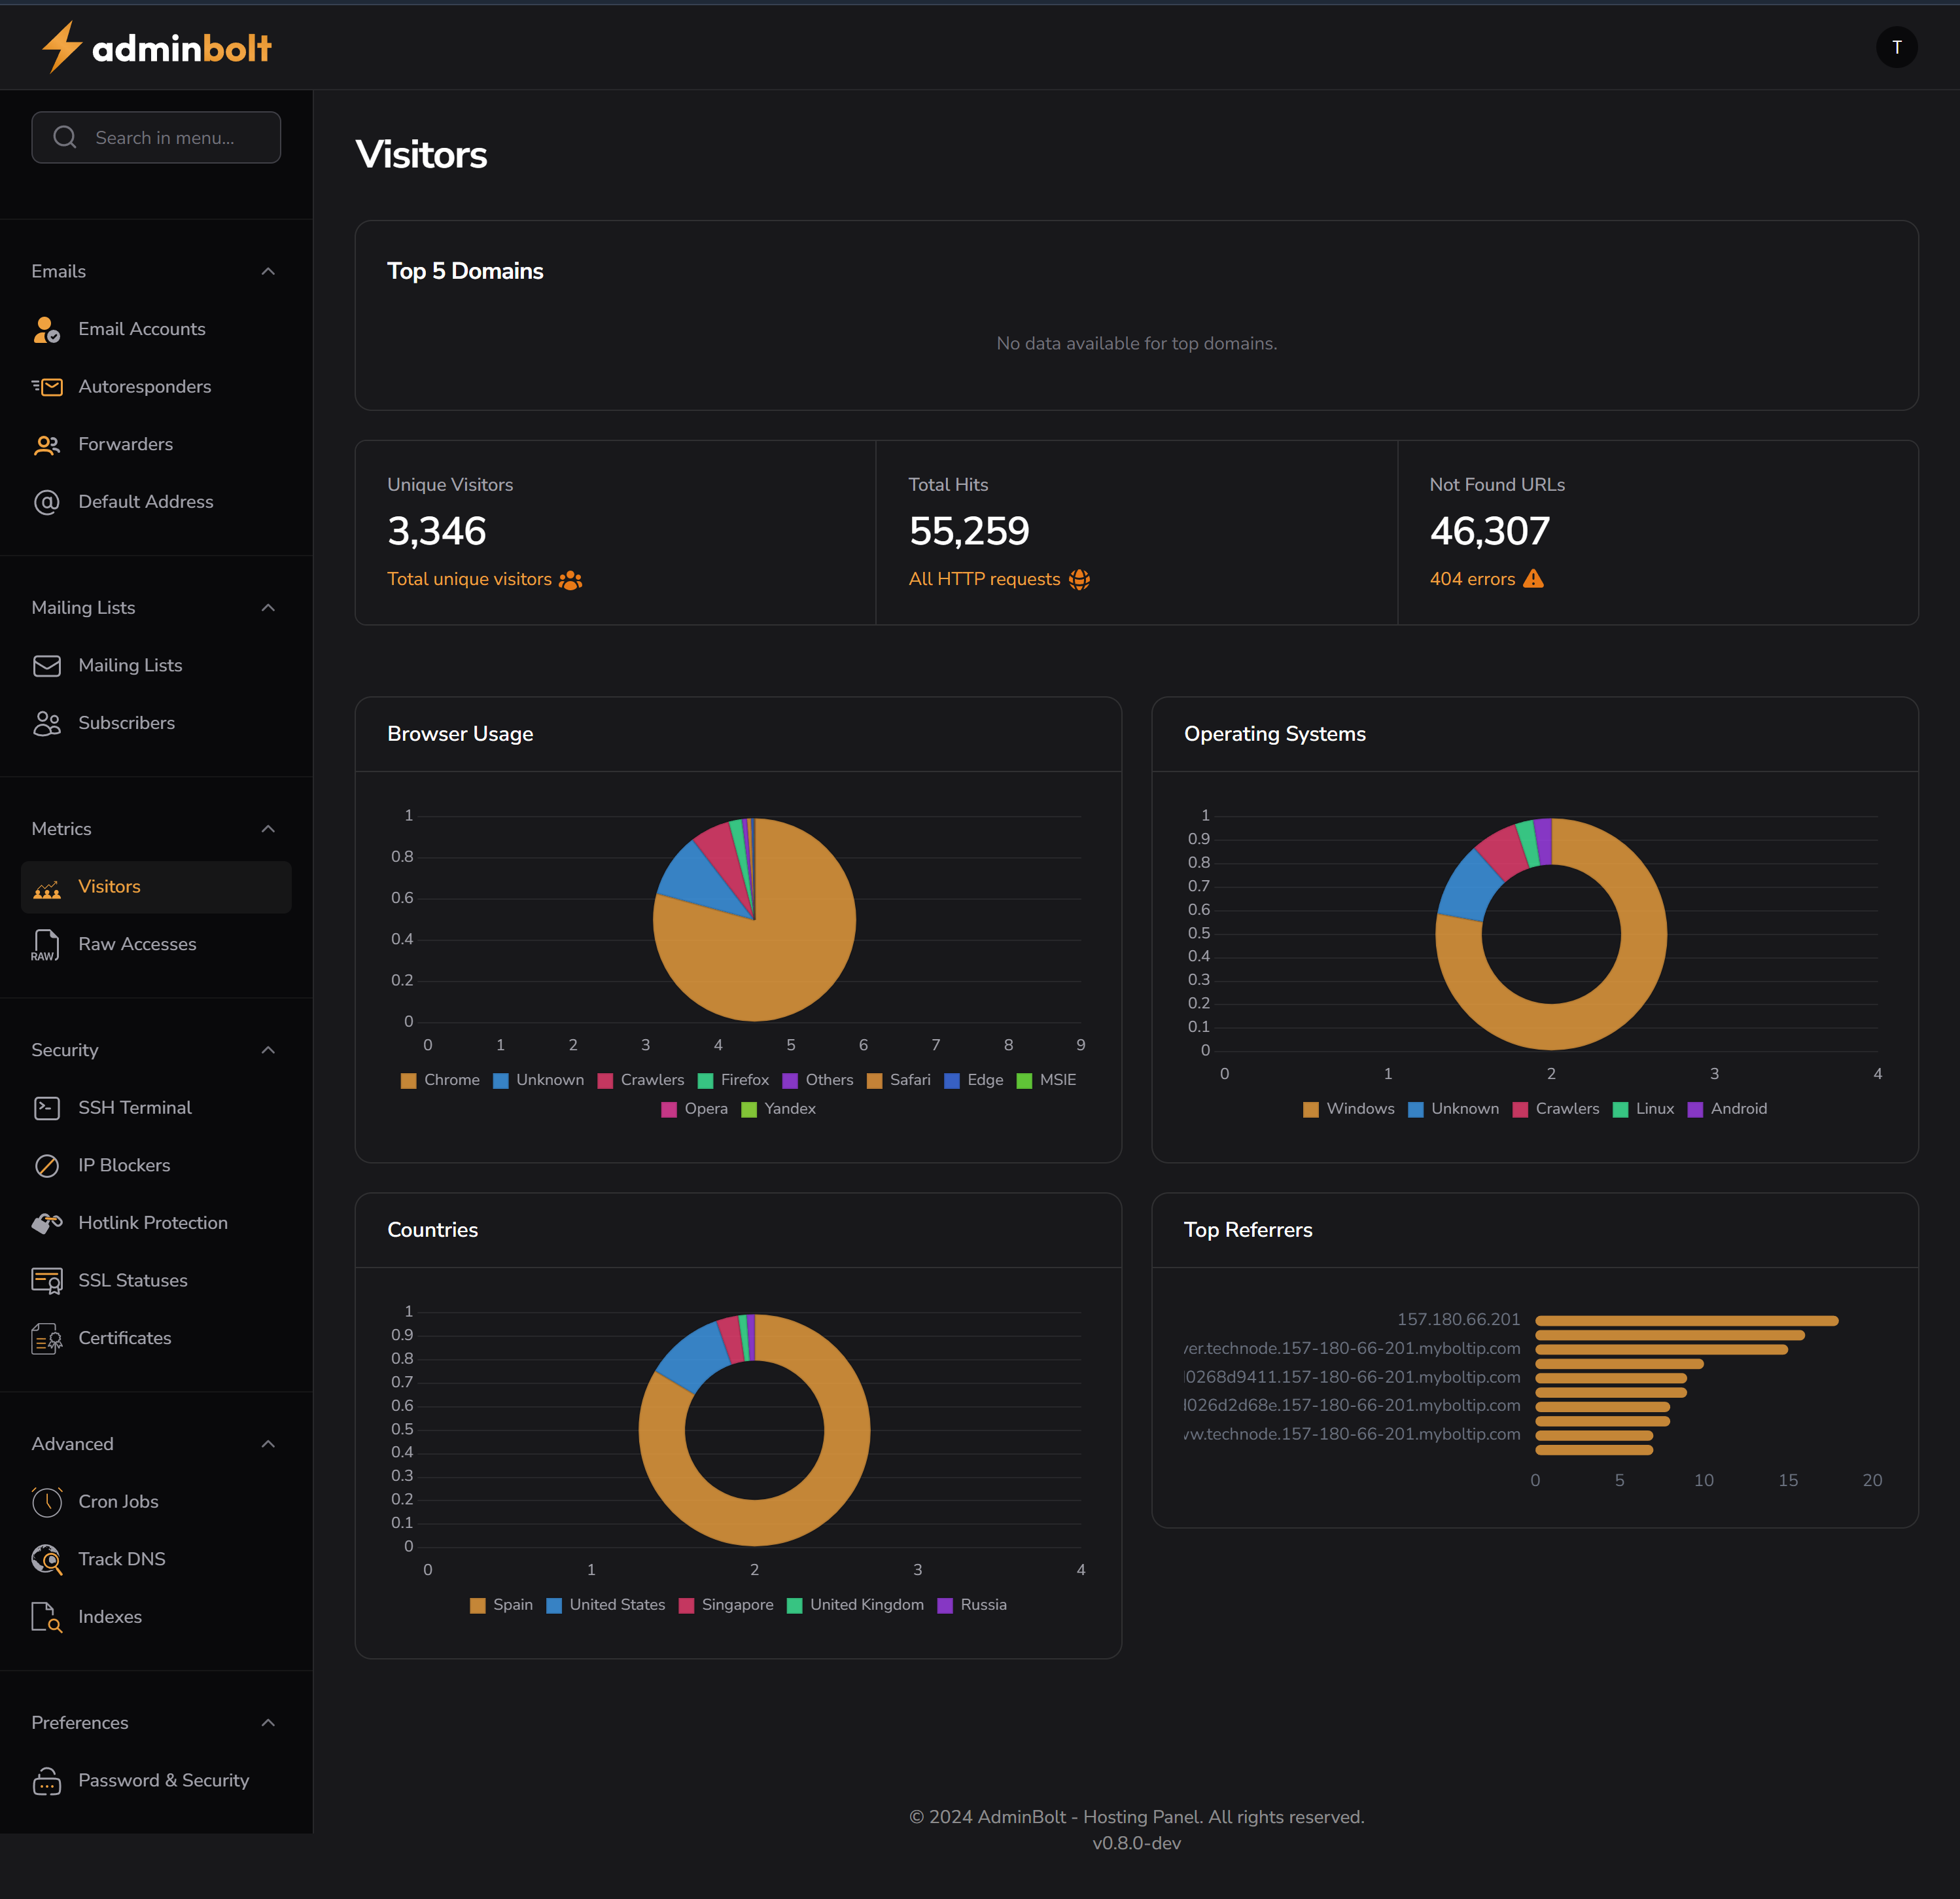
The Visitors section in AdminBolt provides a visual analytics dashboard showing traffic patterns, browser and OS usage, and user behavior across hosted websites. It helps administrators and site owners monitor performance, detect issues, and understand their audience.
Key Metrics
Summary Statistics
| Metric | Description |
|---|---|
| Unique Visitors | 3,346 – Number of distinct site visitors |
| Total Hits | 55,259 – Total HTTP requests made |
| Not Found URLs | 46,307 – 404 errors (pages not found) |
High number of 404s may indicate broken links or missing content.
Charts and Graphs
Browser Usage
Pie chart showing distribution of browsers:
- Chrome, Firefox, Safari, Edge, Opera, Yandex
- Also includes Unknown, Crawlers, and MSIE
Operating Systems
Pie chart displaying operating system breakdown:
- Windows
- Linux
- Android
- Unknown
- Crawlers
Countries
Geographic origin of traffic:
- Spain, United States, Singapore, United Kingdom, Russia
Top Referrers
Bar chart of most frequent referring URLs:
- e.g.
123.456.789.01,res.mydomain.com
Useful for identifying which links are driving the most traffic to your site.
Notes
- Data is aggregated across all hosted domains.
- Helpful for SEO audits, link monitoring, and access trend analysis.
- "No data available" in Top 5 Domains may indicate no configured virtual hosts or unfiltered logs.
Location in Sidebar
Metrics → Visitors
Related Sections
Recommendations
- Investigate top 404s to fix broken links.
- Use browser/OS data to improve cross-device compatibility.
- Analyze referrers to optimize content promotion strategies.