

DEPRECATED
This feature is no longer available in the current panel. The page is kept for reference and may be removed in a future release.
App Health
⚠️ Deprecated — this page documents a view that is not present in the current panel version. The feature may have been moved or removed. The page is kept for reference.
App Health provides real-time monitoring and performance insights for your application cache, exceptions, requests, and usage metrics.
Overview
URL: /admin/app-health
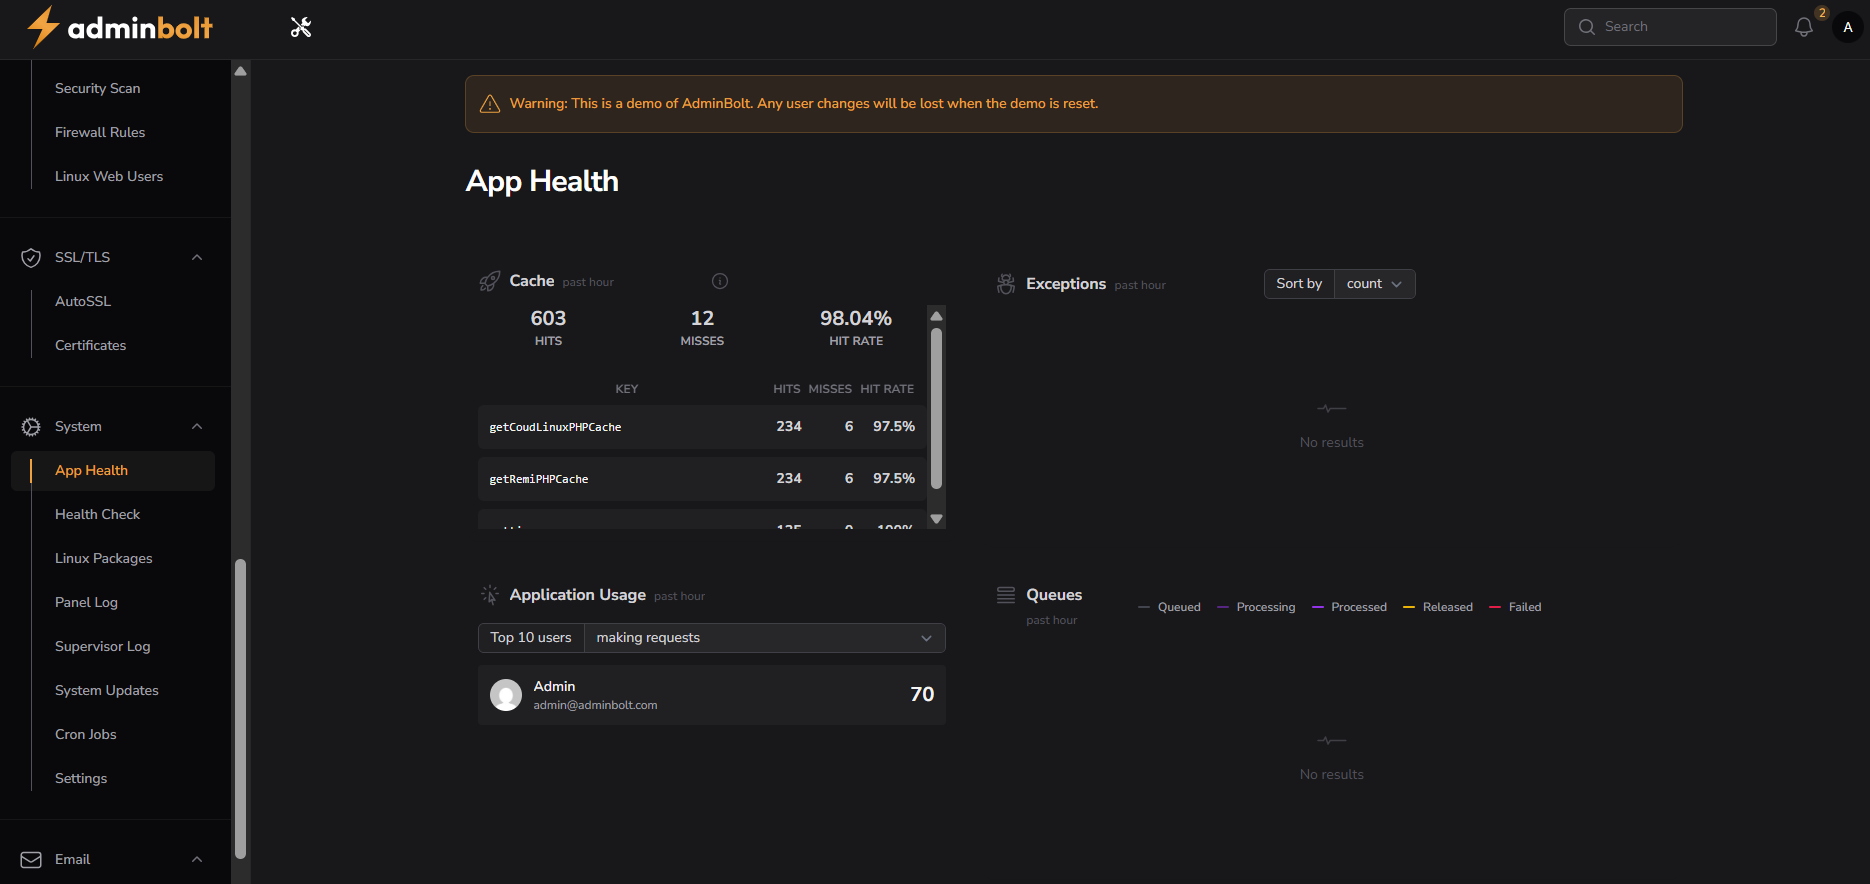
Cache Performance
- Hits Counter - Successful cache retrievals (past hour).
- Misses Counter - Failed cache retrievals (past hour).
- Hit Rate - Success rate for cache operations.
Cache Detail Table
| Column | Description |
|---|---|
| Key | Cache function identifiers. |
| Hits | Successful retrievals per function. |
| Misses | Failed retrievals per function. |
| Hit Rate | Success percentage per function. |
Application Usage
- User Activity Tracker - Shows top users by request volume.
- Request Counter - Displays number of requests per user.
- User Information - Shows user email and identification.
Exception Monitoring
- Exception Counter - Tracks application errors (past hour).
- Sort Controls - Allows sorting by count or other metrics.
Queue Management
Queue status display with visual representation of the processing pipeline:
- Queued
- Processing
- Processed
- Released
- Failed
Performance Metrics
- Slow Queries - Database queries exceeding 1000ms threshold.
- Slow Requests - API requests exceeding 1000ms threshold.
- Slow Outgoing Requests - External service calls exceeding 1000ms threshold.