

Watchdog Dashboard
The Watchdog Dashboard provides real-time monitoring and health metrics for all services registered with the Watchdog service. It gives administrators a quick overview of overall system health and per-service availability.
Overview
URL: /admin/watchdog-dashboard
The dashboard summarizes the state of all monitored services and is the primary entry point for service health observability in adminbolt.
Actions
- Refresh – Reloads metrics and service status data.
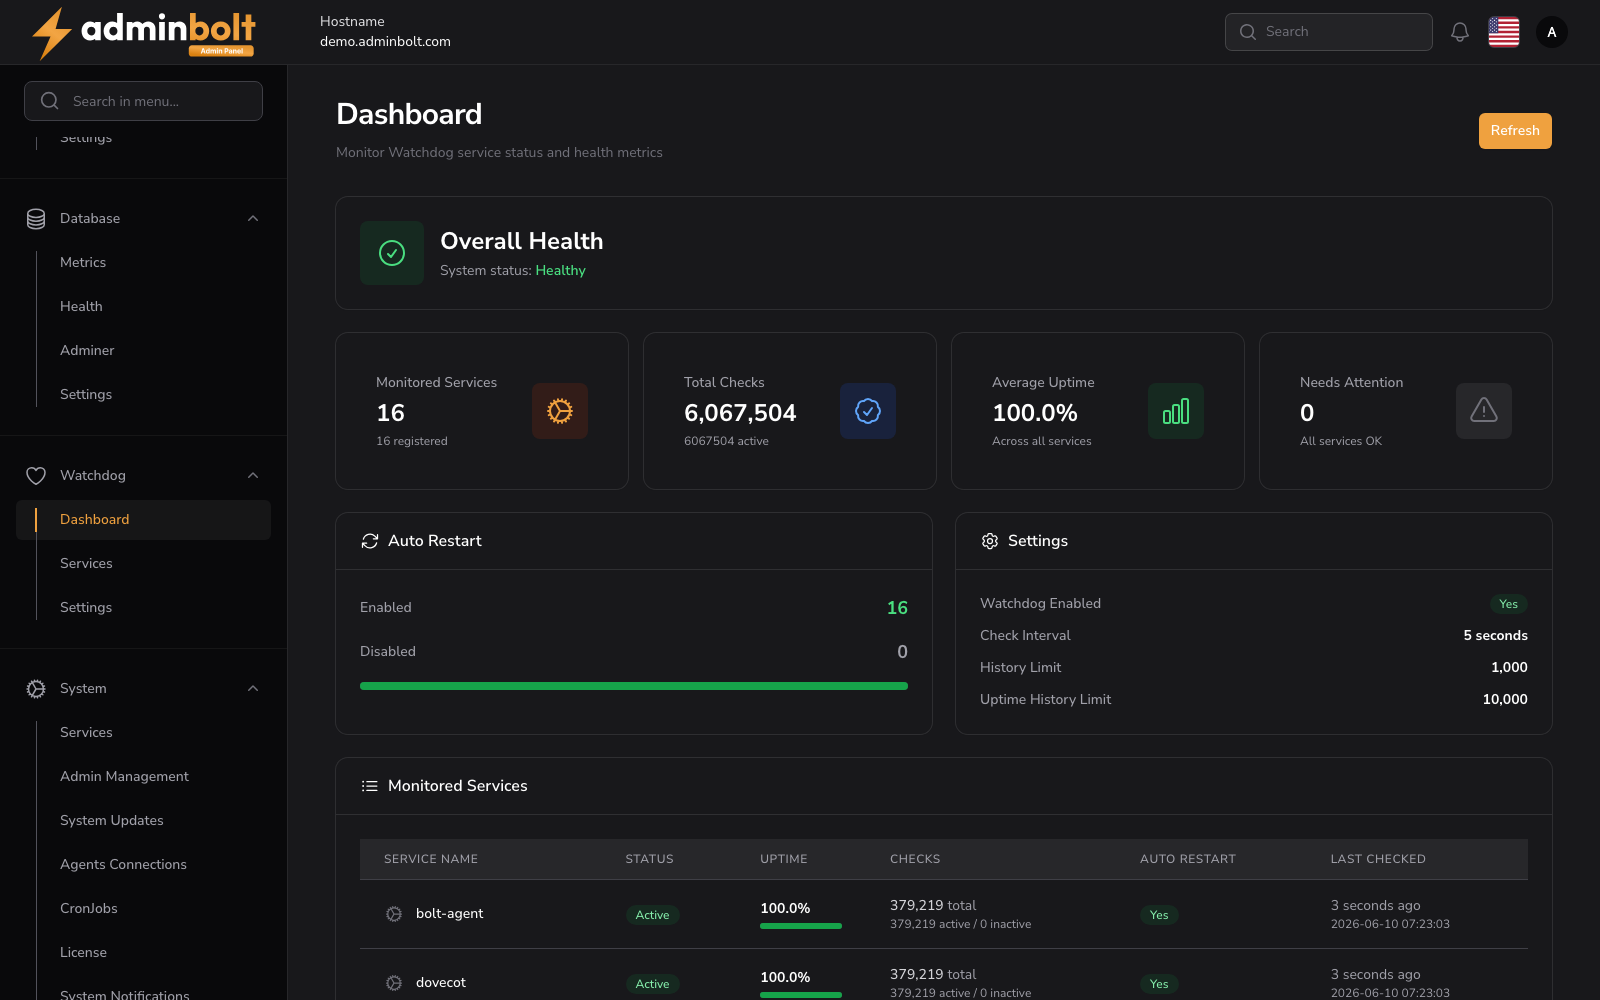
Health Summary Cards
The top of the page displays a row of summary cards:
- Overall Health – Aggregated system status (e.g.,
Healthy,Degraded,Unhealthy). - Monitored Services – Total number of services registered with Watchdog.
- Total Checks – Cumulative number of health checks performed.
- Average Uptime – Mean uptime percentage across all services.
- Needs Attention – Number of services currently in a non-healthy state.
- Auto Restart – Counts of services with auto-restart enabled vs disabled.
Settings Summary
A read-only summary of the active Watchdog configuration:
- Watchdog Enabled – Whether the Watchdog service is active.
- Check Interval – Frequency of service checks (in seconds).
- History Limit – Maximum number of historical records retained.
- Uptime History Limit – Maximum number of uptime history records retained.
To change these values, use Watchdog Settings.
Monitored Services Table
Below the summary, a table lists every registered service with the following columns:
- Service Name – Name of the service (e.g.,
httpd,mariadb,postfix,sshd). - Status – Current state (
Active,Inactive). - Uptime – Percentage uptime over the tracked window.
- Checks – Total checks performed, broken down into active and inactive counts.
- Auto Restart – Whether auto-restart is enabled for this service.
- Last Checked – Time of the most recent check and the absolute timestamp.
Related Pages
- Watchdog Services – Per-service detail view with register and auto-restart controls.
- Watchdog Settings – Global Watchdog configuration.