

Metrics
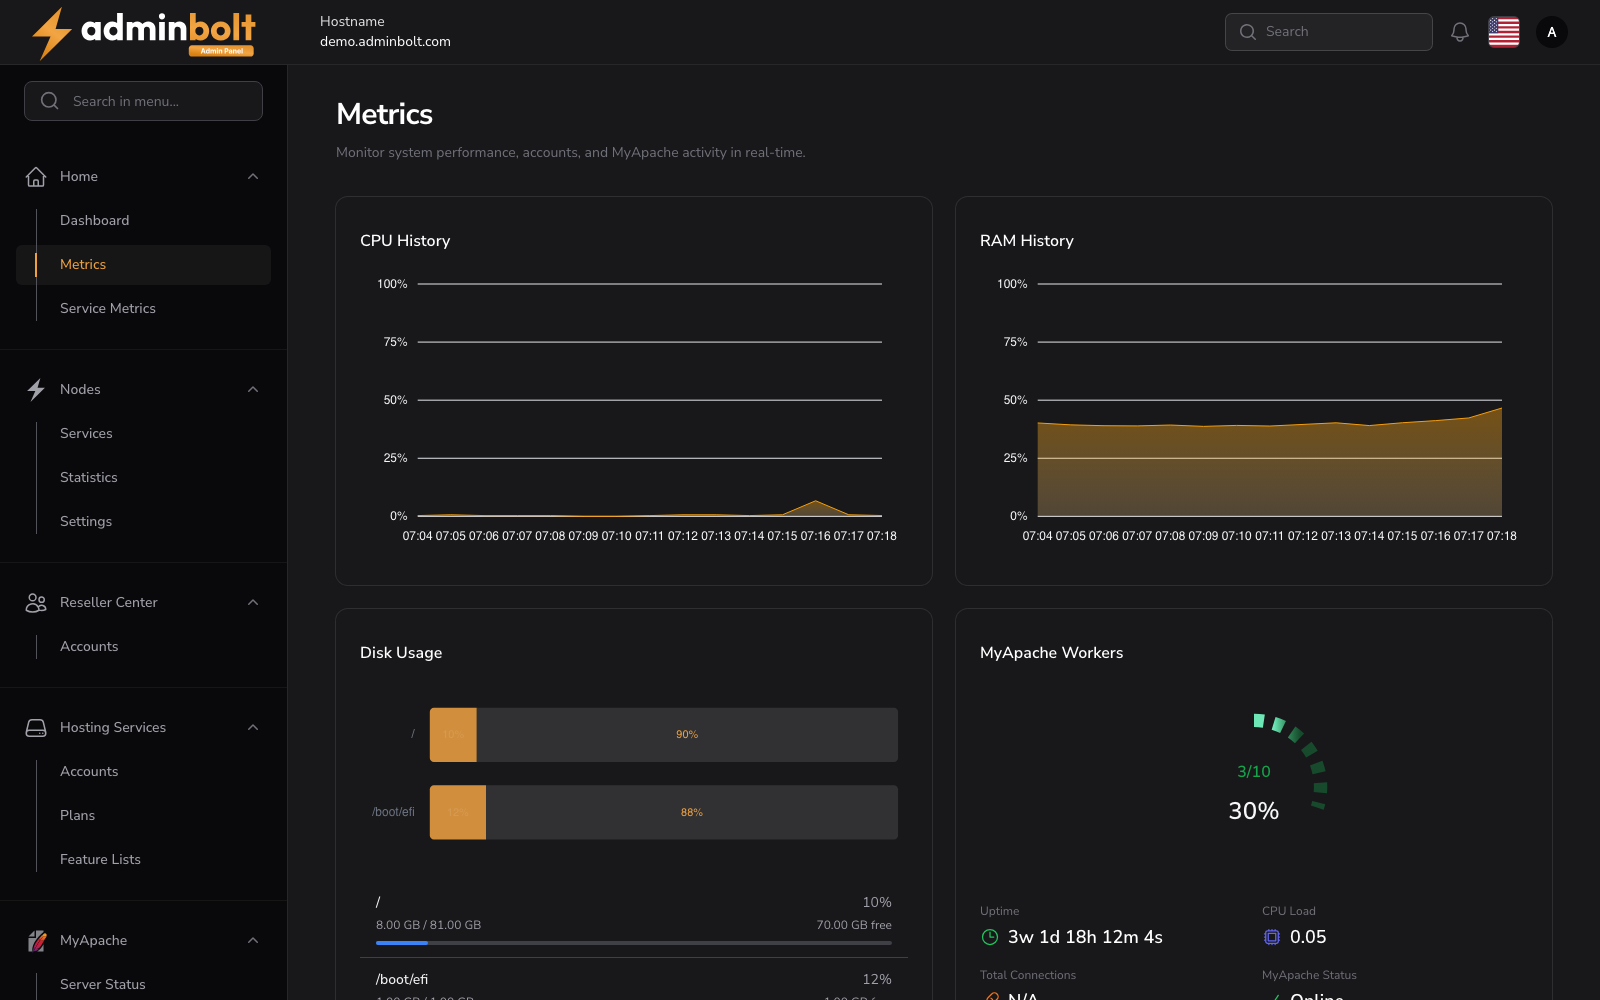
The Metrics page provides real-time system performance monitoring, displaying CPU, memory, and system information for the server.
Overview
URL: /admin/metrics
The page header reads: "Monitor system performance, accounts, and MyApache activity in real-time."
This page is divided into three main sections: System Overview, Memory, and CPU Performance Metrics.
System Overview
Displays basic information about the server:
- Hostname - The server's hostname.
- Platform - The operating system (e.g.,
linux). - Architecture - The CPU architecture (e.g.,
amd64). - Kernel - The kernel version.
- Distribution - The Linux distribution and version (e.g.,
AlmaLinux 9.7). - Uptime - How long the server has been running.
Memory
Displays current memory usage:
- Total - Total available memory in GB.
- Used - Currently used memory in GB.
- Free - Available free memory in GB.
- Usage - Memory usage as a percentage.
CPU Performance Metrics
CPU Information
- Model - The CPU model name.
- Cores - Number of CPU cores.
Overall CPU Usage
- Average - Average CPU usage percentage.
- Maximum - Maximum recorded CPU usage percentage.
- Minimum - Minimum recorded CPU usage percentage.
- Current Usage - Current CPU usage percentage.
Per-Core CPU Usage
Displays metrics for each individual CPU core, including:
- Current - Current usage percentage for the core.
- Average - Average usage for the core.
- Maximum - Maximum recorded usage for the core.
- Minimum - Minimum recorded usage for the core.