
Hub Dashboard
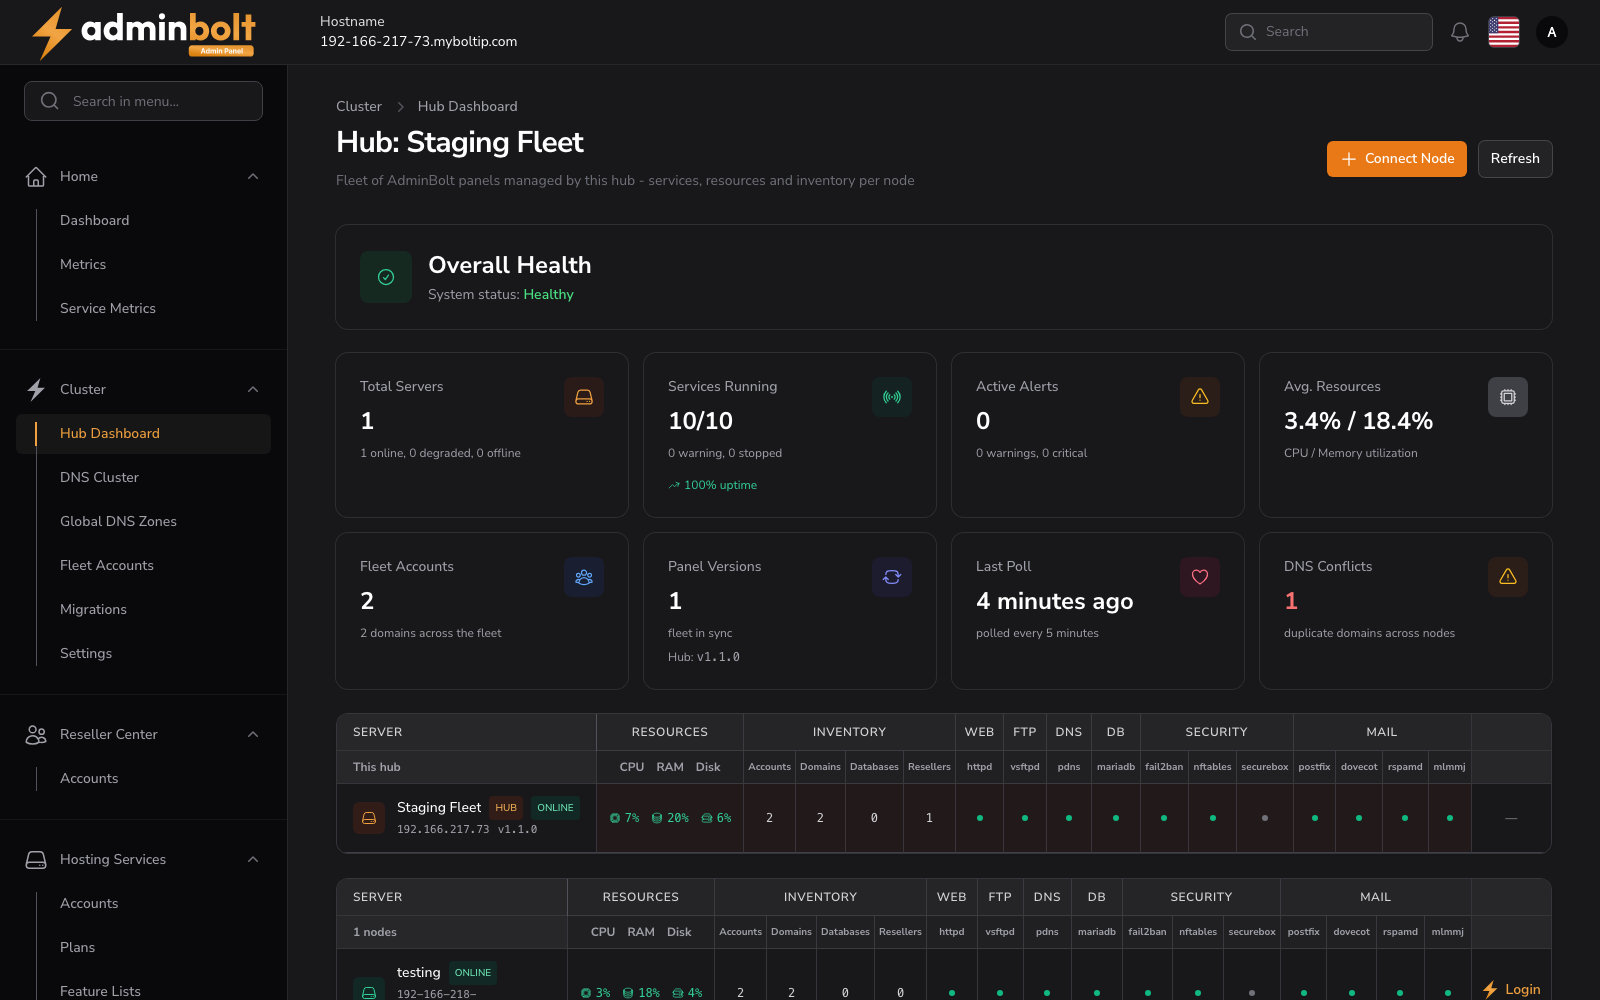
The Hub Dashboard is the home screen for a multi-server setup. It lists every AdminBolt panel managed by this hub and shows each server's resources, inventory, and service status at a glance.
Overview
URL: /admin/cluster - the first page of the Cluster group. Its earlier address /admin/hub leads here. The page title shows the hub display name (for example, Hub: Fleet One).
The hub and its nodes - services, resources and inventory of every server in the cluster
This page is available once Hub Mode is enabled. Overall health is derived from how many servers are online, degraded, or offline.
Actions
- Connect Node - opens the flow to add a remote AdminBolt panel to the hub (see Nodes).
- Refresh - reloads resource, inventory, and service data from every member.
Servers table
Each row is one server. The hub appears first, tagged HUB and ONLINE; each connected node follows as its own row with its resources and per-service status.
| Group | Columns |
|---|---|
| Server | Server name, address, and panel version. |
| Resources | CPU, RAM, Disk usage per server. |
| Inventory | Accounts, Domains, Databases, and Resellers counts. |
| Web / FTP / DNS / DB | Status of httpd, vsftpd, pdns, and mariadb. |
| Security | Status of fail2ban, nftables, and securebox. |
Status of postfix, dovecot, rspamd, and mlmmj. |
Each service shows a colored indicator (running, stopped, or inactive).
Node health and polling
The hub polls every node every 5 minutes and derives a health status for each one, shown alongside a last poll: X ago label:
- Online (green) - the node answered its most recent poll.
- Degraded - the node answered, but one or more of its services or metrics reported a problem.
- Stale - no successful poll for about 7 minutes. The node's metrics are kept but flagged as too old / unreachable.
- Offline (red) - no successful poll for about 15 minutes, or the node has never been polled.
When a node is stale or offline, its resource and inventory figures are the last values the hub collected, not live data. Use Refresh on the dashboard, or Check Health Now on the Nodes page, to poll a node immediately instead of waiting for the next cycle.
Empty state
Until nodes are connected, the panel below the table reads:
No nodes found. Add and activate nodes to see their service status here.
The hub's own row is always shown, so you can monitor the hub server even before any nodes join.