

Dashboard
The Dashboard is the first screen after signing in: a real-time overview of the hosting infrastructure, and the shortest route to anything that needs you.
Overview
URL: /admin/dashboard
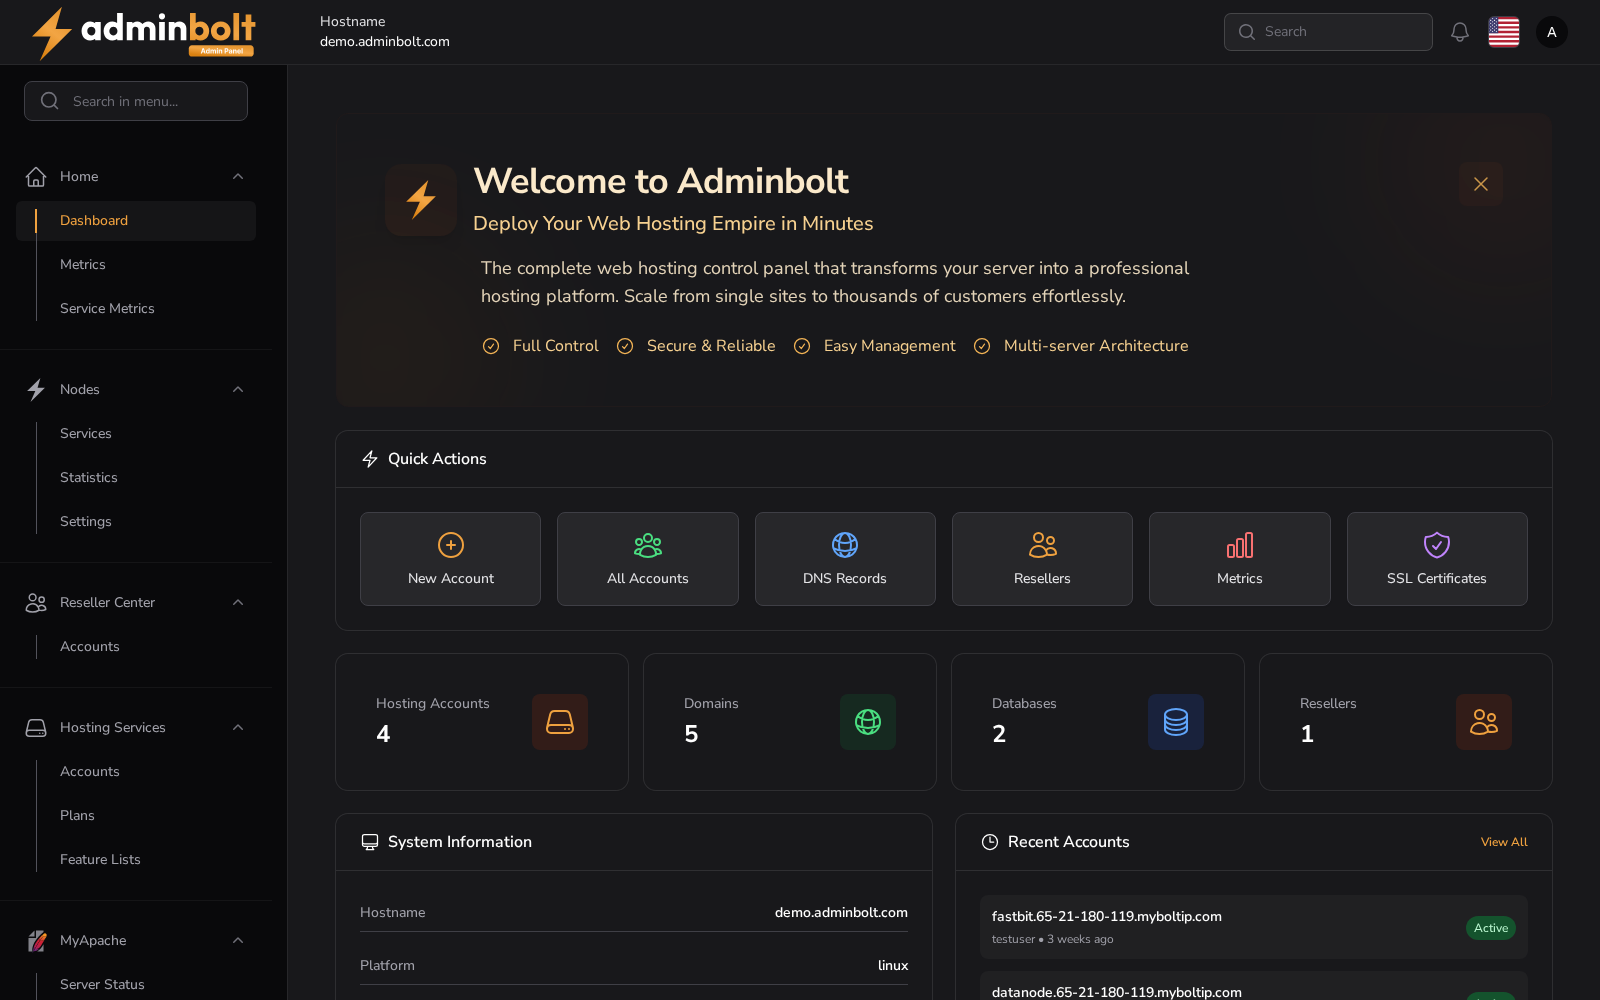
Counters
Five counters run across the top: Total Accounts, Domains, Resellers, Databases, and Mailboxes. Each shows the change over the past week, so you can tell growth from a flat week without opening a report.
Server load
CPU, RAM, and disk for the machine you are signed in to, as bars with the raw figures beside them. This is the current reading, not an average.
Needs attention
The findings from Health, summarised. Each line states what is wrong and why it matters, and View health opens the full page with the next action for each item.
An empty panel here means the checks ran and found nothing, not that nothing was checked.
Nodes overview
Remote AdminBolt panels connected to this one as a hub. On a standalone server the panel invites you to add your first node. See Cluster.
System status
A one-line verdict per subsystem: Web, Database, Mail, DNS, and Background Jobs. View all services opens Health, where each of them can be restarted or re-provisioned.
AI usage
Tool calls made by the AI assistant over the last seven days. Empty until the assistant is used.
Top accounts and domains
Top Accounts by Usage ranks accounts by disk and bandwidth, and Top Domains by Mailbox Count ranks domains by how many mailboxes they hold. Both link to the full report.
Updates
Whether the panel is on the latest release, with the version you are running. Use Settings > System > System Updates to act on it.